Golden Crossover: A Bullish Signal You Should Know About

Golden Crossover: A Bullish Signal You Should Know About
In the world of stock market trading and investing, technical indicators play a vital role in predicting price trends and assisting decision-making. One such powerful and widely followed signal is the Golden Crossover. This indicator has historically signaled the potential start of long-term bullish trends in stocks and indices.
Let’s understand what a golden crossover is, why it’s considered significant, and how traders and investors use it to their advantage.
📌 What is a Golden Crossover?
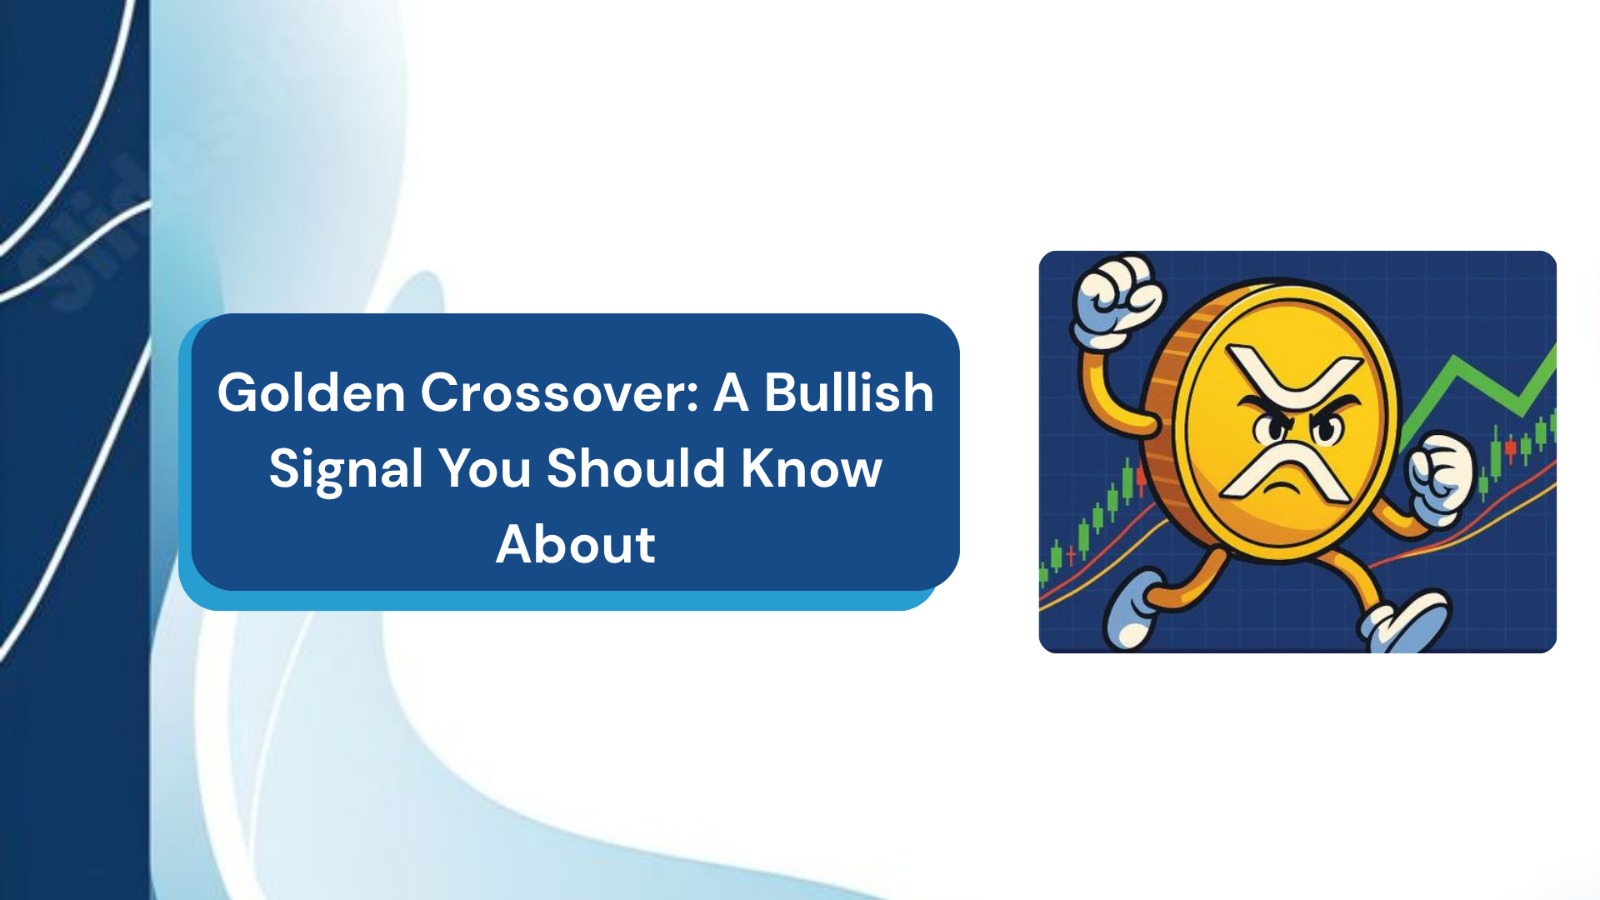
A Golden Crossover occurs when the 50-day Simple Moving Average (SMA) crosses above the 200-day Simple Moving Average (SMA) on a price chart.
- The 50-day SMA represents the short-to-medium term trend.
- The 200-day SMA reflects the long-term price trend.
When the faster-moving 50-day SMA moves above the slower-moving 200-day SMA, it indicates that recent prices are gaining strength compared to their long-term average — a positive sign often interpreted as a strong bullish trigger.
📌 Why Is the Golden Crossover Important?
The golden crossover is significant because it suggests that market momentum is shifting towards a positive trend. Historically, many major stock market rallies have been preceded by this technical event.
Key reasons why the golden crossover matters:
- It signals long-term buying interest.
- Institutional investors and funds often track this event and may enter positions post-crossover.
- It builds market confidence, attracting both short-term traders and long-term investors.
- Indicates a shift in trend sentiment from bearish/sideways to bullish.
For example, when the Nifty 50 index or a heavyweight stock like Reliance Industries witnesses a golden crossover, it draws significant market attention, increasing the chances of sustained buying.
📌 How Does It Impact the Market?
1️⃣ Increased Market Participation:
As soon as the golden crossover is confirmed, retail traders, institutional investors, and mutual funds may increase their buying positions, leading to higher volumes and liquidity.
2️⃣ Boost in Market Sentiment:
The crossover reflects improving market sentiment, with traders interpreting it as the beginning of a long-term uptrend.
3️⃣ Formation of a New Trend:
It often results in a medium to long-term uptrend in the stock or index. While short-term pullbacks can occur, the broader direction usually remains positive post-crossover.
4️⃣ Attracts Technical Traders:
Momentum traders and algorithm-based funds monitor golden crossovers, as it fits into many quantitative trading systems.
📌 Are There Any Risks?
While the golden crossover is a reliable long-term signal, it’s not foolproof. Markets can sometimes witness false signals where the price rallies briefly post-crossover but then reverses. External factors like global events, earnings results, or economic changes can impact price action.
To avoid false breakouts:
- Confirm the crossover with volume support.
- Check other indicators like RSI or MACD for added confirmation.
- Keep an eye on broader market sentiment and fundamental developments.
Conclusion
The Golden Crossover is one of the most respected and reliable technical patterns in stock market analysis. While it’s a powerful bullish indicator, like all market tools, it works best when combined with volume analysis, other technical indicators, and awareness of fundamental events.
For long-term investors and position traders, a golden crossover can be a timely cue to enter promising opportunities while keeping market risks in check
Our Recent FAQS
Frequently Asked Question &
Answers Here
What is the difference between a golden crossover and a death crossover?
A Golden Crossover occurs when the 50-day SMA crosses above the 200-day SMA, signaling a bullish trend. A Death Crossover is the opposite — when the 50-day SMA crosses below the 200-day SMA, indicating a bearish trend.
Is the golden crossover a reliable signal?
Can a golden crossover occur on any time frame?
How long does the bullish trend last after a golden crossover?
Should beginners trade based on golden crossovers?
Copyright © By Empirical F&M Academy. Design & Developed by Techno Duniya


.jpg)


.jpeg)


