
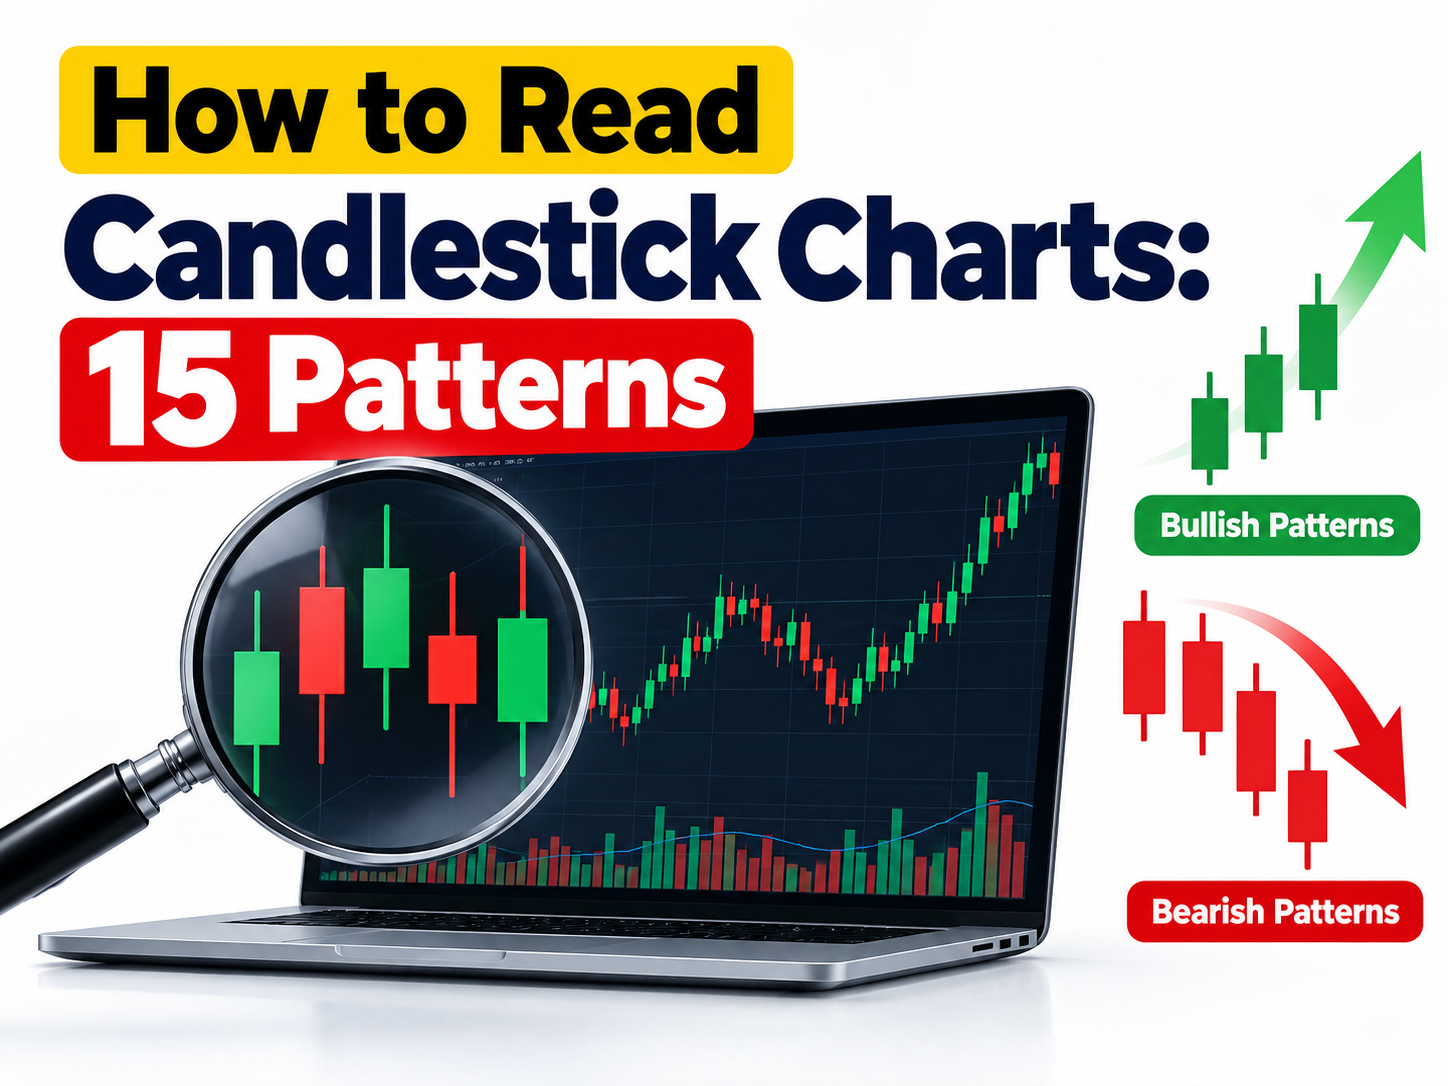
How to Read Candlestick Charts: 15 Patterns
How to Read Candlestick Charts: 15 Patterns
If you have ever looked at a stock chart and seen small red and green bars stacked next to each other, you were looking at candlestick charts. They look confusing at first. But once you understand the basics, candlesticks become one of the easiest and most powerful ways to read the market.
In this guide, we will break down how to read candlestick charts in plain, simple English, and walk through 15 candlestick patterns that traders use every day to spot trend reversals, continuations, and market indecision.
Whether you are a complete beginner or brushing up before your next trade, this guide is written to be your one-stop reference. If you want structured, hands-on training on how to apply these patterns live in the market, our Empirical F&M Academy course covers candlestick reading as part of a full futures and market trading curriculum.
What Is a Candlestick Chart?
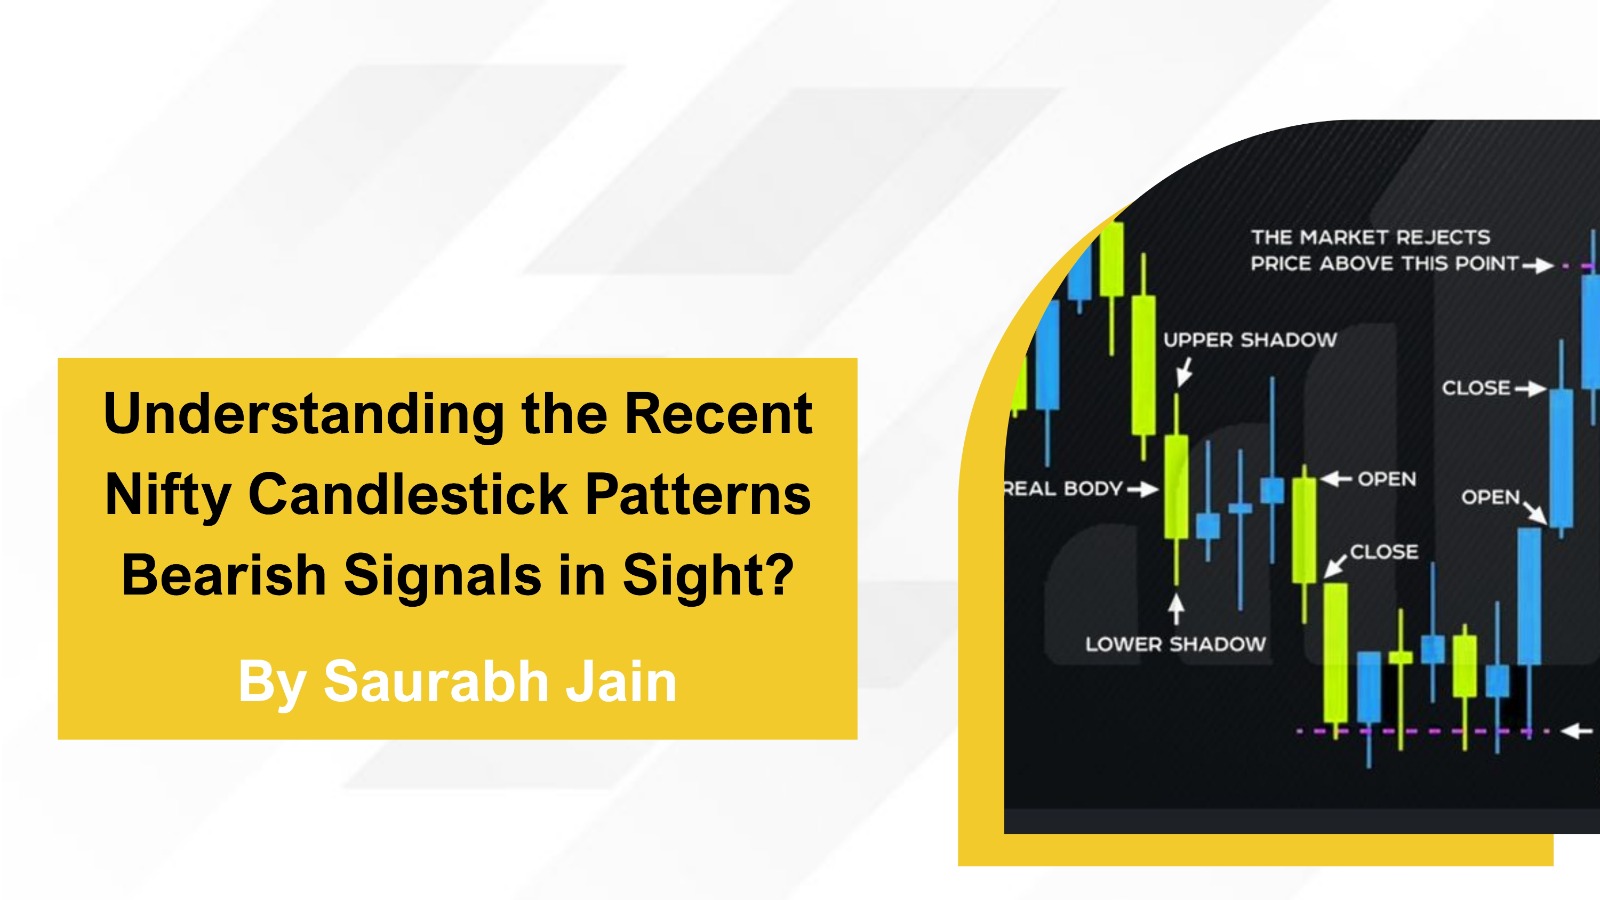
A candlestick chart shows the price of a stock, index, or currency pair over a fixed period of time — it could be 1 minute, 1 hour, 1 day, or even 1 week. Each "candle" on the chart tells you four things:
- Open — the price when the period started
- Close — the price when the period ended
- High — the highest price reached during that period
- Low — the lowest price reached during that period
The Two Parts of a Candle
- The Body — the thick rectangular part. It shows the range between the open and close price.
- A green (or white) body means the price closed higher than it opened (bullish).
- A red (or black) body means the price closed lower than it opened (bearish).
- The Wicks (or Shadows) are the thin lines above and below the body. They show the highest and lowest prices touched during that period.
Once you understand this basic structure, reading candlestick patterns becomes much easier. This is exactly where most beginner traders start in our technical analysis training, before moving into live chart practice.
Why Candlestick Patterns Matter
Candlestick patterns matter because they show the psychology of buyers and sellers in the market. A single candle or a group of candles can tell you:
- Whether buyers or sellers are in control
- Whether a trend is about to reverse
- Whether the market is undecided
- Where good entry and exit points might be
This is why candlestick reading is considered a core skill in technical analysis, alongside support and resistance, volume, and trend lines — all of which are taught step-by-step inside the Empirical F&M Academy program.
15 Candlestick Patterns Every Trader Should Know
We have grouped these into bullish patterns (signal prices may go up), bearish patterns (signal prices may go down), and neutral/indecision patterns.
Bullish Reversal Patterns (Signal a Possible Move Up)
1. Hammer: A hammer has a small body near the top of the candle and a long lower wick. It usually appears after a downtrend and signals that sellers pushed the price down, but buyers stepped in and pushed it back up. This often hints at a bullish reversal.
2. Inverted Hammer: This looks like an upside-down hammer — small body near the bottom, long upper wick. It appears after a downtrend and suggests buyers are starting to test higher prices, which could mean a reversal is coming.
3. Bullish Engulfing: This is a two-candle pattern. A small red candle is followed by a larger green candle that completely "engulfs" the previous candle's body. It signals that buyers have taken strong control after a period of selling.
4. Piercing Line: Another two-candle pattern. A red candle is followed by a green candle that opens lower but closes more than halfway up the red candle's body. This shows buying pressure is building.
5. Morning Star: A three-candle pattern: a long red candle, followed by a small-bodied candle (showing indecision), followed by a strong green candle. It is one of the most reliable signs of a bottom forming.
6. Three White Soldiers: Three long green candles in a row, each closing higher than the last. This pattern shows steady, strong buying pressure and often marks the start of a new uptrend.
7. Bullish Harami: A large red candle followed by a small green candle that sits entirely within the previous candle's body. It signals that selling momentum is slowing down and buyers may be about to take over.
Bearish Reversal Patterns (Signal a Possible Move Down)
8. Hanging Man: This looks exactly like a hammer (small body, long lower wick) but appears after an uptrend instead of a downtrend. It warns that sellers are starting to step in.
9. Shooting Star: A small body near the bottom with a long upper wick, appearing after an uptrend. It shows that buyers pushed the price up, but sellers pushed it right back down — a warning sign for the trend.
10. Bearish Engulfing: The opposite of bullish engulfing. A small green candle is followed by a larger red candle that fully engulfs it. This signals sellers have taken control after a period of buying.
11. Dark Cloud Cover: A green candle is followed by a red candle that opens higher but closes more than halfway down the green candle's body. It suggests the uptrend is losing steam.
12. Evening Star: The bearish twin of the morning star: a strong green candle, then a small indecisive candle, then a strong red candle. This often marks the top of an uptrend.
13. Three Black Crows: Three long red candles in a row, each closing lower than the last. This shows strong, sustained selling pressure, often signaling the start of a downtrend.
14. Bearish Harami: A large green candle followed by a small red candle contained within its body. It signals that buying momentum is fading and a reversal down may follow.
Neutral / Indecision Pattern
15. Doji: A doji candle has almost no body — the open and close prices are nearly equal, creating a thin cross or plus-sign shape. It shows the market is undecided between buyers and sellers. A doji after a strong trend can be an early warning that the trend is about to change direction.
How to Use These Patterns in Real Trading
Spotting a pattern is only step one. Here is how experienced traders actually use them:
- Check the trend first. A hammer means very little on its own — it only matters in the context of a prior downtrend or uptrend.
- Confirm with volume. Patterns backed by higher trading volume are more reliable.
- Combine with support and resistance. A bullish engulfing candle at a strong support level is a much stronger signal than one in the middle of nowhere.
- Wait for confirmation. Many traders wait for the next candle to confirm the pattern before entering a trade.
- Never trade a pattern in isolation. Combine candlestick reading with indicators, trend analysis, and proper risk management.
This is exactly the kind of practical, chart-by-chart application that is difficult to learn from articles alone — it is best learned with live examples and mentorship, which is the core of the Empirical F&M Academy course.
Common Mistakes Beginners Make with Candlestick Patterns
- Trading a pattern without context — ignoring the overall trend or key price levels
- Ignoring volume — a pattern with low volume is weaker and less reliable
- Overtrading — trying to trade every single pattern instead of the highest-quality setups
- Skipping risk management — not setting a stop-loss even when a pattern looks strong
- Relying on candlesticks alone — the best traders combine candlestick patterns with broader market structure, not just one signal
Avoiding these mistakes is part of building a disciplined trading process, which is a major focus of the Empirical F&M Academy program.
Frequently Asked Questions
Q1. What is the easiest candlestick pattern to learn first?
The doji and the hammer are usually the easiest for beginners because they involve just one candle and have a clear, simple shape to recognize.
Q2. Are candlestick patterns reliable?
Candlestick patterns are useful signals, not guarantees. They work best when combined with trend analysis, support and resistance, and volume — not used alone.
Q3. How many candlestick patterns should a beginner learn?
Start with the 15 covered in this guide. They cover the most common bullish, bearish, and indecision signals used across stocks, forex, and futures trading.
Q4. Can candlestick patterns be used for day trading?
Yes. Patterns like the bullish engulfing, hammer, and shooting star are widely used on shorter timeframes (1-minute to 1-hour charts) for day trading and intraday entries.
Q5. What is the difference between a bullish and bearish candlestick pattern?
A bullish pattern signals that prices may rise, usually appearing after a downtrend. A bearish pattern signals that prices may fall, usually appearing after an uptrend.
Q6. Where can I learn candlestick patterns with practical, hands-on training?
The Empirical F&M Academy course teaches candlestick reading alongside broader technical analysis and risk management, with real chart examples.
Final Thoughts
Candlestick charts may look intimidating at first, but once you learn to read the story each candle is telling, they become one of the most useful tools in your trading toolkit. Start by mastering these 15 patterns, always trade them in context, and combine them with sound risk management.
If you want to go beyond reading articles and actually practice these patterns on live and historical charts with expert guidance, explore the Empirical F&M Academy course to build a complete, structured trading skill set.
Latest Course





Latest posts




Copyright © By Empirical F&M Academy. Design & Developed by Techno Duniya