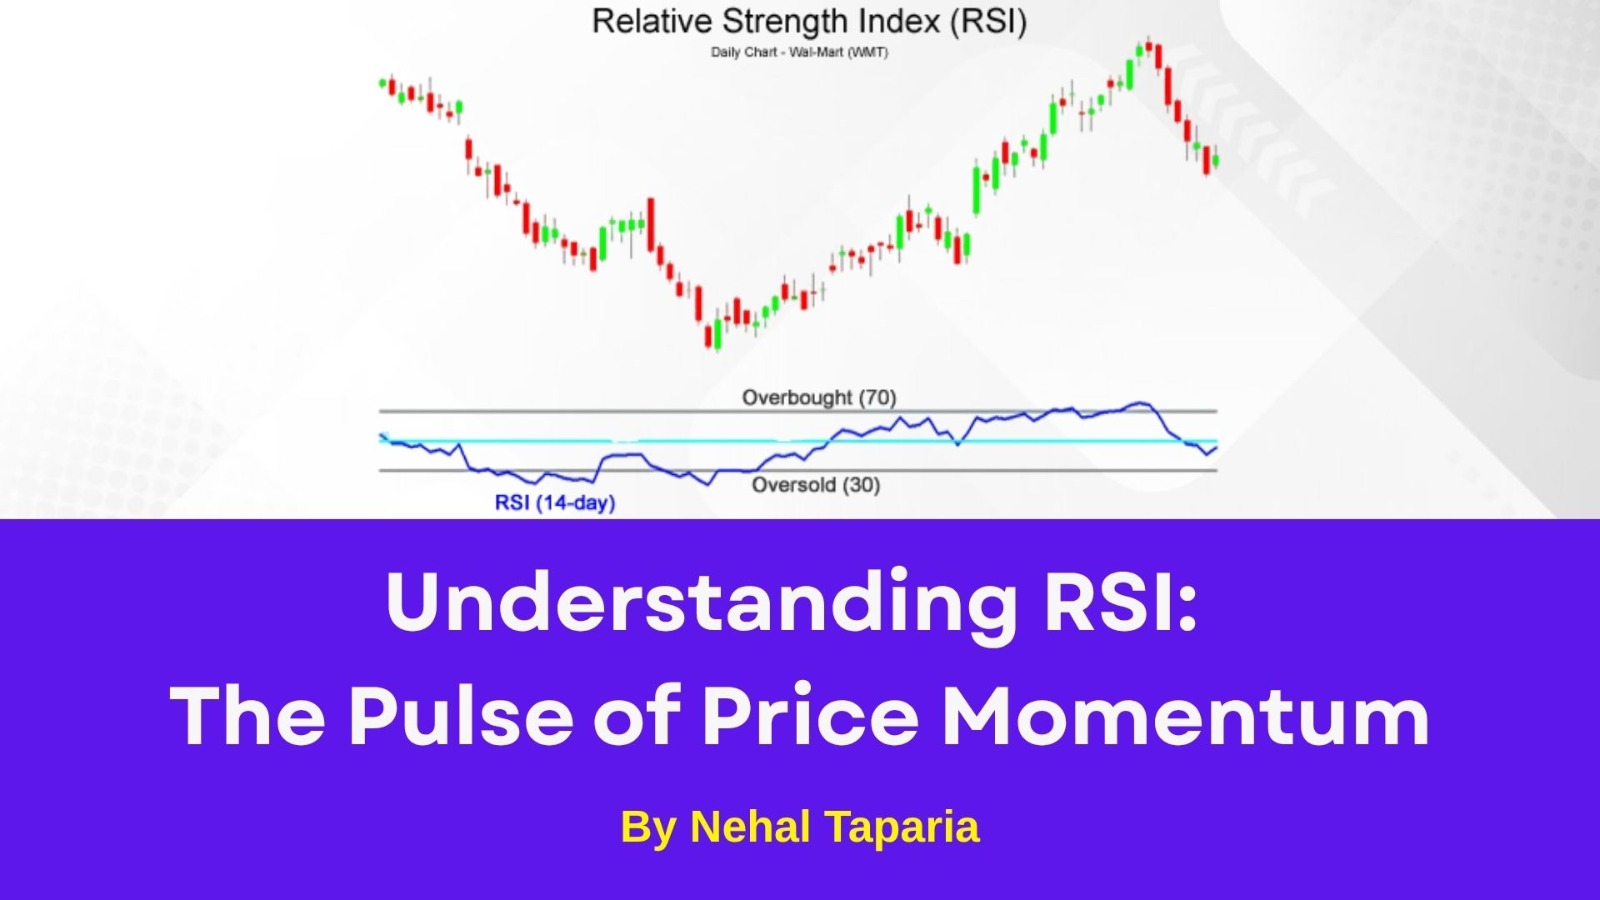
Understanding RSI: The Pulse of Price Momentum

Understanding RSI: The Pulse of Price Momentum
If you’ve ever wondered “Market overbought hai ya oversold?”, then RSI — the Relative Strength Index — is your best friend in Technical Analysis.
At Empirical F&M Academy, we often tell our students: RSI is not just a number; it’s the heartbeat of market momentum. Whether you’re trading intraday, swing, or positional, understanding RSI helps you make smarter, data-backed decisions.
What is RSI?
RSI (Relative Strength Index) is a momentum oscillator developed by J. Welles Wilder. It measures the speed and change of price movements and moves between 0 to 100.
RSI above 70 → Market is overbought (possible reversal down).
RSI below 30 → Market is oversold (possible reversal up).
RSI between 40–60 → Market is in a neutral zone.
It’s one of the most commonly taught tools in our Technical Analysis Course and Advanced Technical Analysis Program at Empirical Institute, helping traders understand when to buy, sell, or stay patient.
How RSI Helps Traders
Identifies Trend Strength – RSI helps you know if the uptrend or downtrend still has momentum.
Catches Reversals Early – Divergences between price and RSI can warn of potential reversals.
Works Across Timeframes – Whether you trade intraday or positional, RSI adapts easily.
Combines Well with Other Indicators – Pair RSI with Moving Averages or Support-Resistance for better accuracy.
RSI Formula
[RSI = 100 - \frac{100}{1 + RS}]
where
[RS = \frac{\text{Average Gain over 14 periods}}{\text{Average Loss over 14 periods}}]
Typically, RSI is calculated using a 14-period setting, but traders often tweak it (like 9 or 21) to suit their trading style.
Pro Tip from Empirical Training Experts
“Never use RSI alone! Combine it with volume and price action to confirm signals.”
Trainers at the Academy of Stock Market, Empirical F&M Academy
Our Advanced Technical Analysis Course teaches traders how to use RSI along with MACD, Bollinger Bands, and candlestick patterns for high-probability trades.
RSI Example in Action
Suppose the Nifty 50 has been rising continuously for a week, and RSI hits 78. That’s a warning sign — the market may be overheated. Smart traders start booking profits or tightening stop losses.
Similarly, if RSI drops below 30, it might be time to look for buying opportunities — especially if supported by volume and positive news flow
Final Thought
RSI is like a thermometer of market emotion — showing when prices are overheated or due for recovery. But remember, the magic lies in interpretation, not just the indicator.
If you want to master RSI and other indicators professionally, explore Empirical Training courses like:
Technical Analysis Course
Futures & Options Trading Course
Equity Research and Valuation Program
Each program at Empirical Institute blends market theory + Practical practice — making you confident, disciplined, and profitable in your market journey.
By Nehal Taparia
This content is for educational and knowledge purposes only and should not be considered as investment or Trading advice. Please consult a certified financial advisor before making any investment or Trading decisions.
Our Recent FAQS
Frequently Asked Question &
Answers Here
What is the ideal RSI level to buy or sell?
Generally, below 30 is a buy signal (oversold), and above 70 is a sell signal (overbought). But professional traders also look for divergences rather than only these fixed levels.
Can RSI be used for intraday trading?
What is RSI divergence?
What’s the difference between RSI and MACD?
Where can I learn RSI and Technical Analysis in detail?
Copyright © By Empirical F&M Academy. Design & Developed by Techno Duniya


.jpg)


.jpeg)


