
Best Technical Indicators for Intraday Trading (2026 Guide)
Best Technical Indicators for Intraday Trading (2026 Guide)
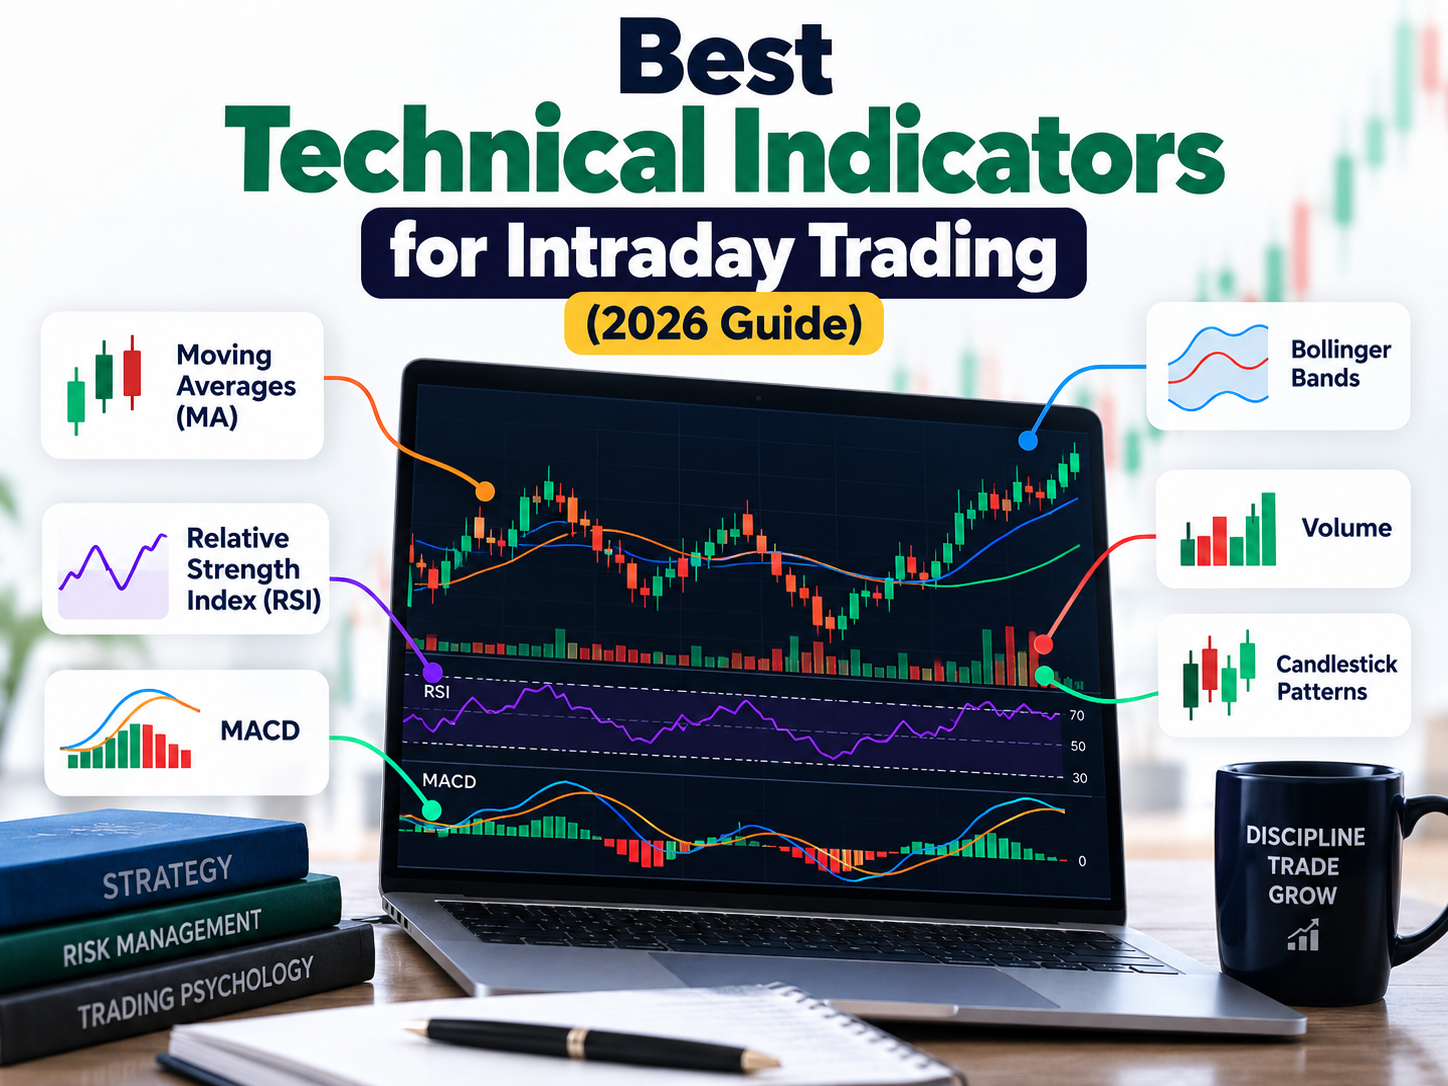
If you're searching for the best technical indicators for intraday trading, you already know that timing is everything in day trading. Unlike long-term investors, intraday traders need tools that react fast, filter out noise, and give clear entry and exit signals within minutes or hours — not weeks.
This guide breaks down the most reliable intraday trading indicators used by professional traders, explains how each one works, and shows you how to combine them into a practical day trading strategy.
Disclaimer: This article is for educational purposes only and does not constitute financial advice. Trading involves risk, and past performance of any indicator does not guarantee future results. Always do your own research or consult a licensed financial advisor before trading.
Why Technical Indicators Matter for Intraday Traders
Intraday trading strategies rely almost entirely on price action and technical analysis, since there isn't enough time in a single session for fundamentals to play out. Indicators help traders:
- Identify trend direction and momentum
- Spot overbought or oversold conditions
- Time entries and exits with more precision
- Manage risk with objective, rule-based signals
Below are the indicators most consistently ranked as the top tools for day trading by traders and analysts.
1. Volume Weighted Average Price (VWAP)
VWAP is one of the most widely used intraday trading indicators, especially among institutional and retail day traders alike.
- What it shows: The average price a stock has traded at throughout the day, weighted by volume.
- How traders use it: Price above VWAP often signals bullish intraday sentiment; price below VWAP signals bearish sentiment. Many traders use VWAP as a dynamic support/resistance line.
- Best for: Intraday trend confirmation and institutional-level entry timing.
2. Relative Strength Index (RSI)
RSI remains one of the most searched momentum indicators for day trading.
- What it shows: Measures the speed and magnitude of recent price changes on a 0–100 scale.
- How traders use it: RSI above 70 suggests overbought conditions; below 30 suggests oversold conditions. Divergence between RSI and price often signals a reversal.
- Best for: Spotting short-term reversals and momentum shifts.
3. Moving Average Convergence Divergence (MACD)
MACD is a favorite among traders looking for trend-following intraday signals.
- What it shows: The relationship between two exponential moving averages (EMA) of price.
- How traders use it: A MACD line crossing above the signal line is a bullish signal; crossing below is bearish. The histogram shows momentum strength.
- Best for: Confirming trend direction and momentum shifts during the trading day.
4. Bollinger Bands
Bollinger Bands help traders visualize volatility-based trading setups.
- What it shows: A moving average with upper and lower bands based on standard deviation.
- How traders use it: Price touching the upper band may indicate overbought conditions; touching the lower band may indicate oversold conditions. Band "squeezes" often precede breakouts.
- Best for: Volatility breakout strategies and range-bound trading.
5. Exponential Moving Average (EMA) & Simple Moving Average (SMA)
Moving averages remain foundational technical indicators for intraday trading.
- What it shows: Smoothed price trend over a chosen period (e.g., 9 EMA, 20 EMA, 50 SMA).
- How traders use it: Crossovers (like the 9/20 EMA crossover) are popular signals for entries; EMAs also act as dynamic support/resistance.
- Best for: Trend identification and confirming direction before entering a trade.
6. Supertrend Indicator
Popular among Indian and Asian markets, Supertrend is a go-to trend-following intraday tool.
- What it shows: A trailing stop and trend-direction line plotted directly on price charts.
- How traders use it: A green Supertrend line signals an uptrend (buy bias); a red line signals a downtrend (sell bias).
- Best for: Simple, visual trend confirmation for beginner and intermediate traders.
7. Average Directional Index (ADX)
ADX helps traders measure trend strength, not direction.
- What it shows: A value from 0–100 indicating how strong a trend is.
- How traders use it: ADX above 25 suggests a strong trend (favorable for trend-following strategies); below 20 suggests a weak or range-bound market.
- Best for: Filtering out low-probability trades in sideways markets.
8. Stochastic Oscillator
Another momentum-based tool frequently used alongside RSI.
- What it shows: Compares a closing price to its price range over a specific period.
- How traders use it: Readings above 80 suggest overbought; below 20 suggest oversold. Crossovers between %K and %D lines generate signals.
- Best for: Short-term reversal trades in range-bound markets.
9. Volume Indicators
Volume confirms the validity of any price move.
- What it shows: The number of shares/contracts traded in a given period.
- How traders use it: Rising price with rising volume confirms trend strength; price moves on low volume are often unreliable.
- Best for: Validating breakouts and avoiding false signals.
How to Combine Indicators for a Complete Intraday Strategy
No single indicator works in isolation. A well-rounded intraday trading strategy typically combines:
- A trend indicator (VWAP, EMA, or Supertrend) — to identify direction
- A momentum indicator (RSI or MACD) — to time entries
- A volatility or confirmation tool (Bollinger Bands or Volume) — to validate the setup
This layered approach reduces false signals and improves the probability of successful trades
Common Mistakes Intraday Traders Make with Indicators
- Relying on a single indicator without confirmation
- Ignoring volume when assessing breakouts
- Using indicators designed for longer timeframes on very short intraday charts
- Overloading charts with too many indicators, causing analysis paralysis
- Not backtesting strategies before trading live capital
Learning to apply these indicators correctly — with proper risk management and a tested strategy — is exactly what separates consistent traders from the rest. If you want structured, mentor-led training on building a complete intraday trading system, the Empirical F&M Academy offers in-depth courses covering technical indicators, chart patterns, and risk management for futures and options traders.
Frequently Asked Questions (FAQ)
Q1: What is the single best technical indicator for intraday trading?
There is no single "best" indicator — most professional traders combine VWAP or moving averages (for trend) with RSI or MACD (for momentum) to build a reliable, confirmed signal.
Q2: Which indicator is most accurate for day trading beginners?
VWAP and moving average crossovers are generally considered the easiest for beginners to understand and apply, since they clearly show trend direction relative to price.
Q3: Can technical indicators guarantee profits in intraday trading?
No. Indicators are probability-based tools, not guarantees. They should be used alongside risk management, position sizing, and a tested trading plan.
Q4: How many indicators should I use at once for day trading?
Most experienced traders limit themselves to 2–3 complementary indicators (one trend, one momentum, one confirmation tool) to avoid conflicting signals.
Q5: Are these indicators suitable for both stocks and futures/options intraday trading?
Yes. RSI, MACD, VWAP, and moving averages are widely applicable across equities, futures, options, and forex markets, though optimal settings may vary by asset class and volatility.
Conclusion
Mastering the best technical indicators for intraday trading — VWAP, RSI, MACD, Bollinger Bands, moving averages, Supertrend, ADX, and volume — gives traders a structured, data-driven edge in fast-moving markets. The key isn't memorizing indicators, but learning how to combine them into a coherent, risk-managed strategy.
Ready to go deeper? Explore the Empirical F&M Academy for hands-on training in technical analysis, indicator-based strategies, and professional risk management for intraday and F&O trading.
Latest Course





Latest posts



Copyright © By Empirical F&M Academy. Design & Developed by Techno Duniya