
How to Read Day Trading Indicators & Market Signals Like a Pro

How to Read Day Trading Indicators & Market Signals Like a Pro
If you have spent any time watching the markets on NSE or BSE, you already know that intraday trading is not a game of luck. It is a game of reading the market correctly, timing your entries and exits, and using the right tools to back your decisions. And that is exactly where trading indicators come in.
The best indicators for day trading do not predict the future. What they do is give you a structured, data-driven way to understand price behavior, momentum, and market sentiment in real time. Whether you are trading Nifty 50 stocks, Bank Nifty options, or mid-cap equities, having the right set of technical indicators on your chart can make a massive difference in your results.
In this blog, we are going to break down the most effective trading indicators used by live traders in India and explain how each one fits into a practical intraday trading strategy.
Why Trading Indicators Matter for Intraday Trading in India?
The Indian stock market moves fast. From morning around 9:00 AM to late noon around 4:00 PM, prices can swing dramatically based on global cues, FII activity, and sector-specific news. Without a structured approach, it is very easy to make emotional decisions.
Technical indicators help you stay grounded. They take historical price and volume data and turn it into actionable signals. The key is knowing which indicators to use, when to use them, and how to combine them for a high-probability intraday trading strategy.
Here is what good trading indicators can help you do:
- Identify trend direction before entering a trade
- Spot momentum shifts early
- Find key entry and exit zones
- Manage risk more effectively
- Avoid false breakouts and fakeouts
1. Moving Average Indicator
The moving average indicator is probably the most widely used tool in intraday trading. It smooths out price data to show you the underlying trend clearly. Live traders in India commonly use three types: the Simple Moving Average (SMA), the Exponential Moving Average (EMA), and the Volume Weighted Moving Average (VWMA).
How traders use the moving average indicator in intraday trading:
- The 9 EMA and 21 EMA crossover is a popular signal for short-term momentum. When the 9 EMA crosses above the 21 EMA, it is often seen as a bullish entry signal.
- The 200 EMA on a 5-minute chart helps traders understand whether the broader trend is bullish or bearish.
- Price trading above or below the 20 EMA is often used as a quick filter for trade direction.
- VWMA combines volume and price, making it especially useful during high-volume market sessions in the first hour of trading in India.
Moving averages work best when the market is trending. During sideways or choppy markets, they can produce false signals, so always combine them with other technical indicators.
2. Support and Resistance Indicator
Every experienced intraday trader will tell you that support and resistance levels are the backbone of any solid trading strategy. The support and resistance indicator helps you identify price zones where buying or selling pressure has historically been strong.
Here is how to work with support and resistance in intraday trading:
- Mark the previous day's high and low levels on your chart before the market opens. These are critical intraday reference points.
- Watch for price reactions at round numbers like 18000, 19500 on Nifty. These act as psychological support and resistance zones.
- A breakout above resistance with high volume often signals a strong intraday move.
- A rejection at resistance with a bearish candle pattern is a solid sell signal.
- Support turning into resistance after a breakdown is an important confirmation for short trades.
Many live traders in India pair the support and resistance indicator with candlestick patterns to improve entry accuracy. When you see a hammer or bullish engulfing candle at a key support zone, it significantly improves the probability of a successful trade.
3. RSI - Relative Strength Index
The RSI is one of the best indicators for day trading because it tells you the momentum behind price movement. It ranges from 0 to 100, and most traders in India use a 14-period RSI on a 5-minute or 15-minute chart for intraday trading.
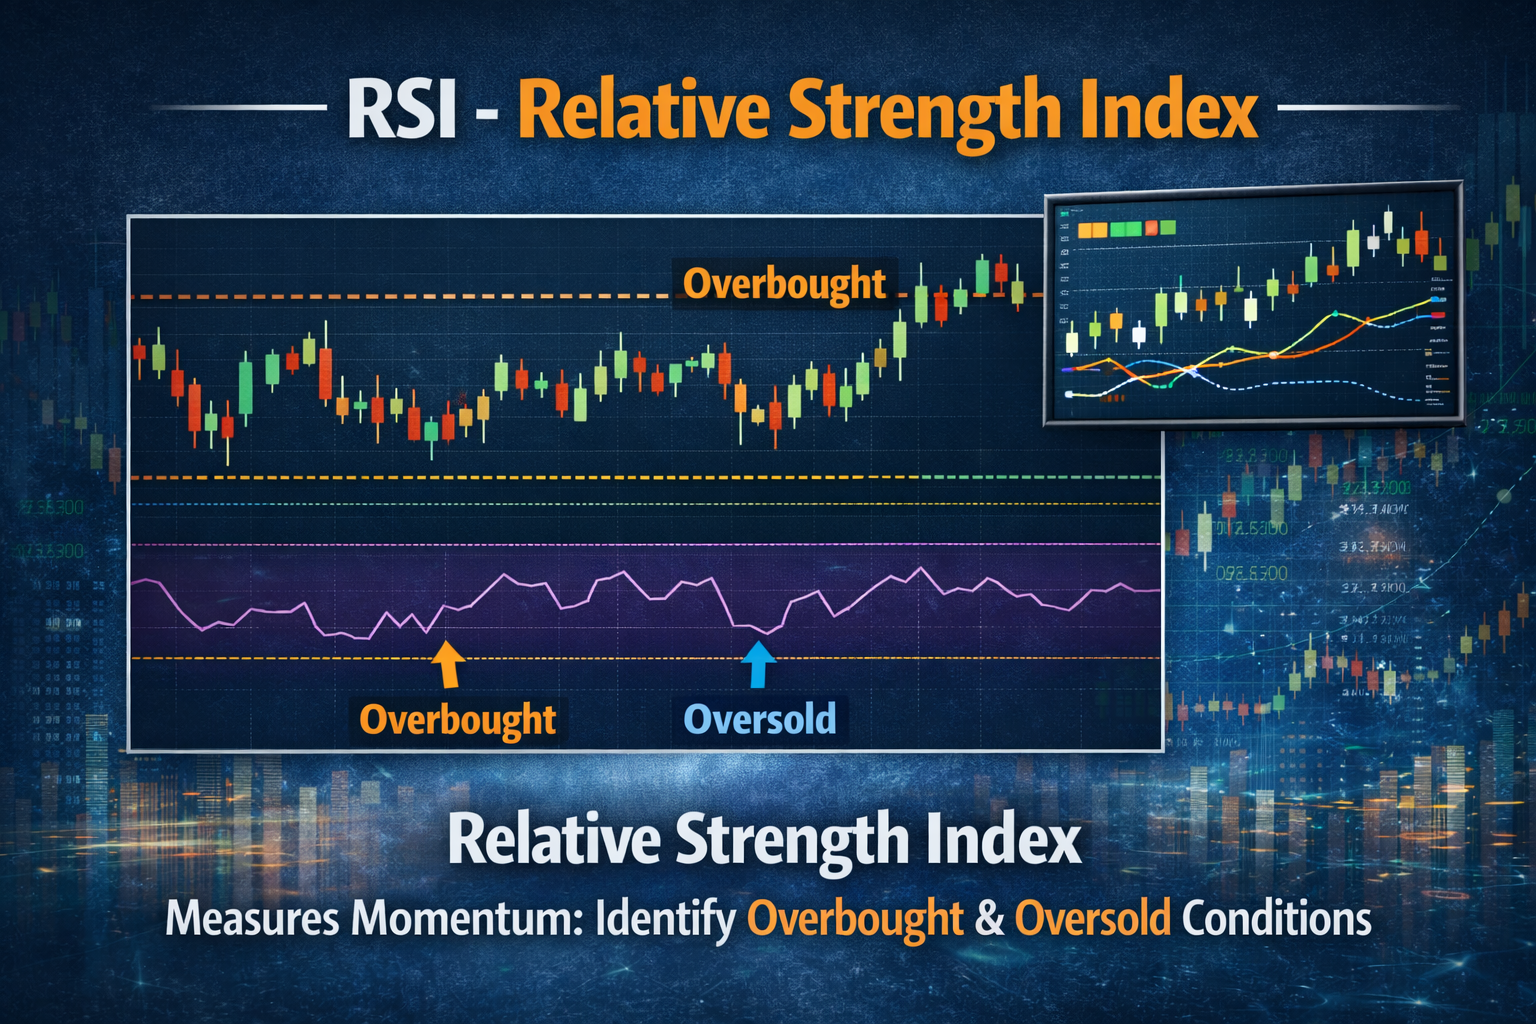
Key RSI signals to watch during intraday trading time:
- RSI above 70 signals an overbought condition. This does not always mean sell immediately, but it is a warning to tighten your stop-loss if you are long.
- An RSI below 30 signals an oversold condition and can be a trigger for buying in a trending stock.
- RSI divergence is extremely powerful. If price makes a new high but RSI makes a lower high, a reversal may be coming.
- RSI crossing above 50 in the early part of the session often confirms bullish intraday momentum.
- For the best indicator for option trading, RSI divergence on Bank Nifty is widely used by options traders.
4. VWAP - Volume Weighted Average Price
VWAP is, without doubt, one of the most important technical indicators for anyone doing intraday trading in India. It represents the average price at which a stock has traded throughout the day, weighted by volume. Institutional traders and live traders heavily rely on VWAP to make decisions.
Why VWAP stands out as a trading indicator:
- Price above VWAP indicates bullish intraday sentiment. Most experienced traders prefer to take long positions when the price is holding above VWAP.
- Price below VWAP indicates bearish sentiment. Short trades are preferred in this zone.
- VWAP retest after a breakout is one of the cleanest entry setups in intraday trading strategies.
- VWAP acts as a dynamic support and resistance level throughout the trading session.
- During the first 30 minutes of intraday trading time, VWAP helps traders gauge the opening range direction.
If you are only going to use one trading indicator consistently in trading India, many professionals would recommend VWAP. Is it that useful?
5. MACD - Moving Average Convergence Divergence
MACD is a powerful trading indicator that combines trend-following and momentum. It consists of the MACD line, signal line, and histogram. For intraday trading strategies, the standard settings of 12, 26, and 9 are widely used across Indian markets.
How to use MACD effectively as part of your intraday trading strategy:
- A MACD line crossing above the signal line is a bullish signal. This works especially well on 15-minute charts for stocks in the Nifty 50.
- When the MACD histogram transitions from negative to positive, it often marks the beginning of a fresh uptrend.
- MACD divergence with price is one of the best signals for option trading as it often precedes sharp moves.
- Using MACD alongside the moving average indicator improves the quality of trade signals significantly.
- Avoid acting on MACD signals during low-volume periods in the middle of the trading session.
6. Bollinger Bands
Bollinger Bands are a volatility-based trading indicator that many live traders in India use to identify breakouts and reversals. The bands expand when volatility is high and contract when the market is quiet.
Practical uses of Bollinger Bands in intraday trading:
- A Bollinger Band squeeze, where the bands come very close together, often signals an upcoming explosive move. Watching for the direction of the breakout gives a high-probability entry.
- Price touching the upper band in a strong uptrend is not automatically a sell signal. It simply means the stock is gaining momentum.
- Price bouncing off the lower band with RSI in oversold territory is a strong buy signal in trending stocks.
- Bollinger Bands work particularly well on Bank Nifty for options traders looking for the best indicator for option trading setups.
- Using Bollinger Bands with volume confirmation reduces the number of false signals in choppy markets.
Building a Complete Intraday Trading Strategy Using These Indicators
Now that you know the individual trading indicators, the real skill lies in combining them into a cohesive intraday trading strategy. Using too many indicators clutters your chart and creates confusion. Using too few leaves you with incomplete information.
A simple and effective framework for intraday trading strategies:
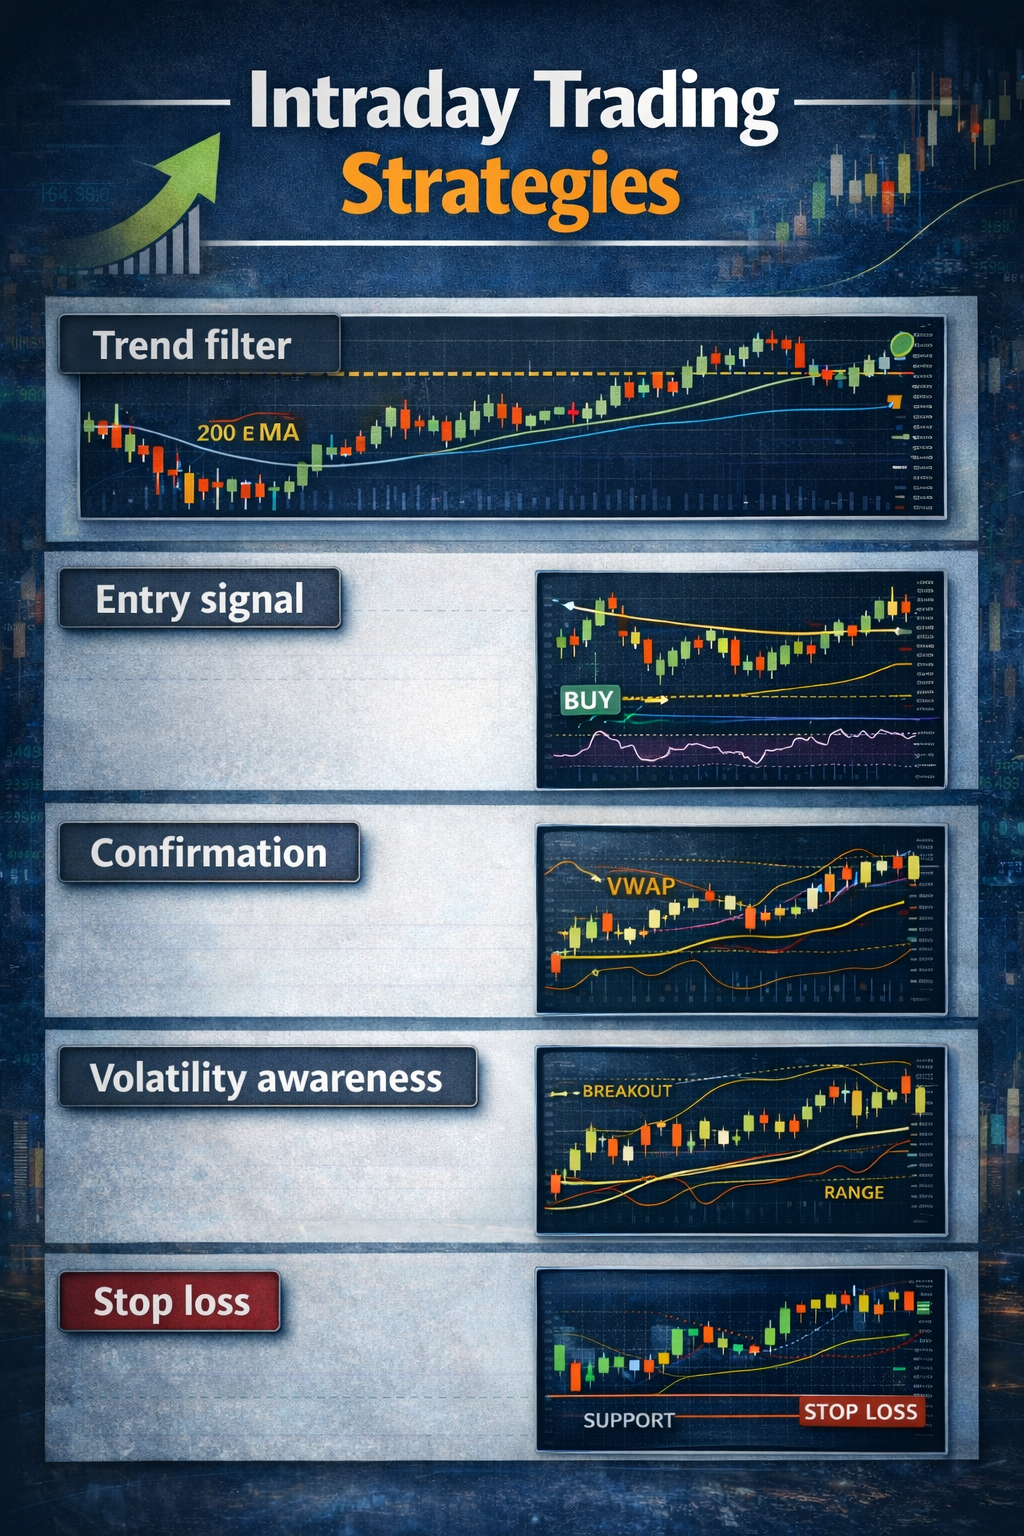
- Trend filter: Use the 200 EMA to identify whether the stock is in an uptrend or a downtrend. Only take trades in the direction of the larger trend.
- Entry signal: Use MACD or RSI crossover near a support and resistance level to time your entry.
- Confirmation: Ensure price is on the right side of VWAP before entering.
- Volatility awareness: Check Bollinger Bands to understand whether the market is in a breakout or a range.
- Stop loss: Place your stop loss just below the nearest support level or the moving average indicator that acted as the entry basis.
This kind of layered approach is what separates casual traders from consistent, profitable live traders in the Indian market.
Intraday Trading Time: When to Use These Indicators
Not all hours of the day are equal in the Indian stock market. The quality of your signals depends heavily on intraday trading time. Here is a rough breakdown that most experienced traders follow:
- 9:15 AM to 9:30 AM: This is the opening range. Avoid entering trades immediately. Let the market establish direction. Watch VWAP and the first 15-minute candle carefully.
- 9:30 AM to 11:30 AM: This is the golden window for intraday trading. Volume is high, moves are strong, and all your technical indicators produce the most reliable signals.
- 11:30 AM to 1:00 PM: Markets often slow down. Avoid overtrading during this period. Stick to only the highest quality setups.
- 1:00 PM to 2:30 PM: Watch for institutional activity. VWAP-based trades and support and resistance breakouts can work well here.
- 2:30 PM to 3:20 PM: Good activity picks up again. Trend continuation trades work well in this window before positions are squared off.
Final Thoughts
The best indicators for day trading are not magic. They are tools. And like any tool, their value depends entirely on how well you use them. The moving average indicator, support and resistance indicator, RSI, VWAP, MACD, and Bollinger Bands each serve a distinct purpose. Together, they give you a comprehensive picture of what the market is doing and where it is likely to go next. The traders who succeed at intraday trading in India are not the ones who use the most indicators. They are the ones who deeply understand a small set of trading indicators and apply them with discipline, patience, and a clear intraday trading strategy.
Start with VWAP and the support and resistance indicator as your foundation. Layer in the moving average indicator for trend context. Add RSI for momentum confirmation. Practice on paper trades, review your results, and refine your intraday trading strategies over time. That is how live traders build consistency in trading in India. The market rewards those who are prepared. Make sure you are one of them.
Latest Course


")
")
Latest posts

")


")
Copyright © By Empirical F&M Academy. Design & Developed by Techno Duniya