
Support and Resistance in Trading: The Complete Guide (2026)
Support and Resistance in Trading: The Complete Guide (2026)
What Are Support and Resistance in Trading?
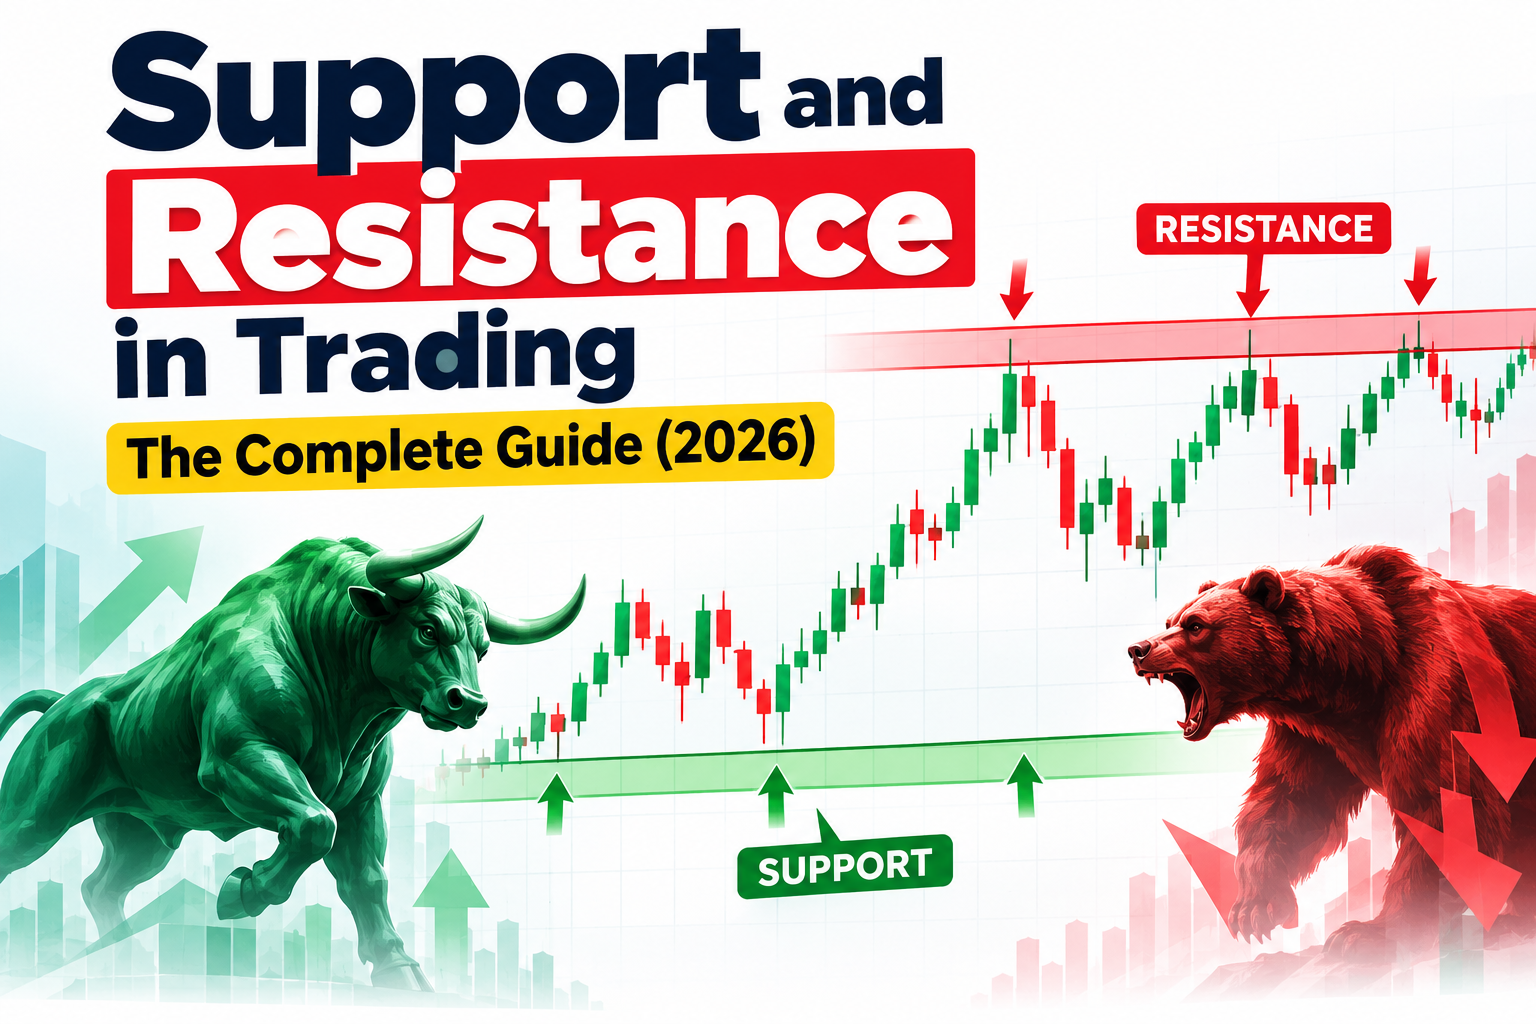
Support and resistance in trading are price levels where a stock, index, or currency pair tends to pause, reverse, or break through because buying or selling pressure concentrates there.
- Support is a price level where buying interest is strong enough to stop a decline. It acts like a floor.
- Resistance is a price level where selling interest is strong enough to stop a rise. It acts like a ceiling.
These two concepts are the foundation of technical analysis. Whether you trade Nifty, Bank Nifty, stocks, forex, or commodities, identifying support and resistance levels helps you decide where to enter, where to place a stop loss, and where to book profits.
If you are new to chart-based trading, our How to Learn Stock Market Trading in India: Complete Roadmap (2026) is a good starting point before going deeper.
Why Do Support and Resistance Levels Work?
Support and resistance work because of trader psychology and order flow:
- Memory of price. Traders remember levels where price reversed before, so they place new orders around them.
- Clustered orders. Buy orders, sell orders, and stop losses build up around round numbers and previous highs and lows.
- Self-fulfilling behavior. When many traders watch the same level, their reactions at that level make it more significant.
- Supply and demand imbalance. At support, demand exceeds supply. At resistance, supply exceeds demand.
Types of Support and Resistance
1. Horizontal Support and Resistance
The most common type. These are flat price zones where the market has reversed multiple times. The more times a level is tested, the more important it becomes.
2. Trendline Support and Resistance (Dynamic Levels)
In an uptrend, a rising trendline connecting higher lows acts as support. In a downtrend, a falling trendline connecting lower highs acts as resistance.
3. Moving Average Support and Resistance
The 20, 50, 100, and 200-period moving averages often behave as dynamic support in uptrends and resistance in downtrends. Traders widely watch the 200-day moving average.
4. Psychological (Round Number) Levels
Levels such as 25,000 on Nifty or 55,000 on Bank Nifty attract heavy orders because traders anchor to round numbers.
5. Fibonacci Retracement Levels
The 38.2%, 50%, and 61.8% retracement levels often line up with support and resistance zones after a strong move.
6. Pivot Points
Widely used by intraday traders, pivot points are calculated from the previous session's high, low, and close to give the day's likely support and resistance.
How to Identify Support and Resistance Levels (Step by Step)
- Start on a higher timeframe. Open the daily or weekly chart first. Levels on higher timeframes are stronger than those on 5-minute charts.
- Mark swing highs and swing lows. Find points where price clearly turned.
- Draw zones, not exact lines. Price rarely reverses at one exact number. Use a band, for example 22,480–22,520.
- Look for multiple touches. Levels tested 3 or more times carry more weight.
- Check volume. A reversal or breakout on high volume is more reliable.
- Confirm with candlesticks. Look for rejection candles such as pin bars, hammers, and engulfing patterns at your levels. See our guide on How to Read Candlestick Charts: 15 Patterns.
- Refine on lower timeframes. Once the major zones are marked, use a 15-minute or 1-hour chart to time entries.
Support Becomes Resistance (and Vice Versa): The Role Reversal Principle
When price breaks below a support level, that broken support often turns into new resistance. When price breaks above resistance, that level often becomes new support.
This is called polarity or role reversal, and it's the basis of many retest trades. After a breakout, price often returns to test the broken level before continuing.
Support and Resistance Trading Strategies
Strategy 1: Bounce (Reversal) Trading
- Buy near strong support when a bullish rejection candle forms.
- Sell near strong resistance when a bearish rejection candle forms.
- Stop loss: just beyond the zone.
- Target: the next opposing level.
Strategy 2: Breakout Trading
- Enter when price closes decisively beyond a level, ideally with above-average volume.
- Stop loss: back inside the broken zone.
- Target: measured move or the next major level.
Strategy 3: Breakout and Retest
- Wait for the breakout, then wait for price to return and hold the broken level.
- This usually offers a better risk-to-reward ratio and fewer false breakouts than entering on the initial break.
Strategy 4: Support and Resistance with Indicators
Combine levels with RSI, MACD, or moving averages for confirmation. For a deeper look, read Best Technical Indicators for Intraday Trading (2026 Guide).
Support and Resistance for Intraday Trading
Intraday traders often use:
- Previous day's high and low
- Opening range high and low (first 15 or 30 minutes)
- Pivot points and VWAP
- Round-number levels on Nifty and Bank Nifty
Because intraday moves are fast, position sizing and stop losses matter as much as the level itself. If you want a structured path, explore the Best Intraday Trading Course Online.
Support and Resistance on Nifty and Bank Nifty
Index traders in India typically track:
- Previous swing highs and lows on daily and weekly charts
- Round levels such as multiples of 500 on Nifty and 1,000 on Bank Nifty
- Option chain data, where strikes with heavy Put open interest are often read as support and heavy Call open interest as resistance
To build a full framework around index trading, see the Nifty & Bank Nifty Trading Strategies & Methods course. If you trade derivatives, our Trade Smart Using Futures and Options (Basic) course covers how to combine levels with option strategies.
Common Mistakes Traders Make with Support and Resistance
- Treating levels as exact lines instead of zones.
- Trading every level. Only high-quality levels with multiple touches deserve attention.
- Ignoring the trend. Buying support in a strong downtrend often fails.
- Entering breakouts without confirmation. Wait for a candle close and volume.
- Placing stop losses exactly at the level. Stop hunts are common. Give the trade room.
- Skipping risk management. Even great levels fail sometimes. Risk a small, fixed percentage per trade.
- Overcrowding the chart. Too many lines create confusion. Keep only the most significant levels.
Support and Resistance Quick Reference
| Feature | Support | Resistance |
|---|---|---|
| Meaning | Price floor where buyers step in | Price ceiling where sellers step in |
| Typical reaction | Price bounces up | Price is rejected down |
| If broken | Becomes new resistance | Becomes new support |
| Common trade | Buy near support | Sell near resistance |
| Stop loss placement | Below the support zone | Above the resistance zone |
Frequently Asked Questions (FAQs)
Q1. What is support and resistance in simple words?
Support is a price level where a falling market tends to stop and bounce, and resistance is a level where a rising market tends to stall and reverse.
Q2. How do you find support and resistance levels?
Mark swing highs and lows on a higher timeframe chart, draw zones around areas where price reversed multiple times, and confirm with volume and candlestick patterns.
Q3. Which is the best timeframe for support and resistance?
Daily and weekly charts give the strongest levels. Intraday traders then refine entries on 5-minute to 1-hour charts.
Q4. Is support and resistance reliable?
It is one of the most widely used tools in technical analysis, but no level works every time. Use it with trend analysis, confirmation signals, and strict risk management.
Q5. What happens when support breaks?
A broken support often turns into resistance, and price may accelerate lower, especially with high volume.
Q6. Can beginners use support and resistance?
Yes. It is one of the easiest technical concepts to learn, and a good foundation for more advanced strategies. Beginners can also read Best Trading Strategies for Beginners in India (2026 Guide).
Q7. Does support and resistance work in forex and commodities?
Yes. The concept applies to any market driven by buyers and sellers, including forex, commodities, crypto, and equities.
Key Takeaways
- Support and resistance are zones, not exact lines.
- Higher timeframe levels are stronger.
- Broken support becomes resistance, and broken resistance becomes support.
- Confirm levels with volume, candlesticks, and indicators.
- Always define your stop loss and risk before entering a trade.
Learn Support and Resistance the Practical Way
Reading about levels is one thing. Applying them live on Nifty, Bank Nifty, and stocks is another. At Empirical F&M Academy, you learn chart reading, price action, and risk management from certified trainers through live, practical sessions.
- Start with Trade Smart Using Technical Analysis, a foundation course covering support, resistance, trends, and patterns
- Prefer Hindi? Try Trade Smart Using Technical Analysis (Hindi)
- Want to see the full catalogue? Browse all Empirical F&M Academy courses
- Have questions? Contact our team
Disclaimer: This article is for educational purposes only and is not investment advice. Trading in securities involves risk. Please consult a SEBI-registered advisor before making financial decisions.
Latest Course





Latest posts



Copyright © By Empirical F&M Academy. Design & Developed by Techno Duniya