
Complete Beginner’s Guide to Fundamental vs Technical Analysis

Complete Beginner’s Guide to Fundamental vs Technical Analysis
What is Fundamental Analysis?
Fundamental analysis is the process of evaluating a company’s financial health and business performance to find its intrinsic value (actual worth).
Key Factors in Fundamental Analysis
When doing fundamental analysis, investors study:
1. Financial Statements
- Income Statement – Shows revenue, expenses, and profit
- Balance Sheet – Shows assets, liabilities, and equity
- Cash Flow Statement – Shows how money flows in and out
These help in understanding whether the company is profitable and financially stable.
2. Important Financial Ratios
Some commonly used ratios include:
- Earnings Per Share (EPS): Profit earned per share
- Price to Earnings Ratio (P/E Ratio): Helps compare valuation
- Return on Equity (ROE): Measures a company's efficiency
- Debt to Equity Ratio: Shows financial risk
These ratios are important for stock valuation for beginners.
3. Business & Industry Analysis
- The company’s competitive advantage
- Industry growth potential
- Market demand
- Government policies
4. Economic Factors
- Inflation
- Interest rates
- GDP growth
- Global economic conditions
These factors impact the overall stock market performance.
Why Fundamental Analysis is Important
Fundamental analysis helps you:
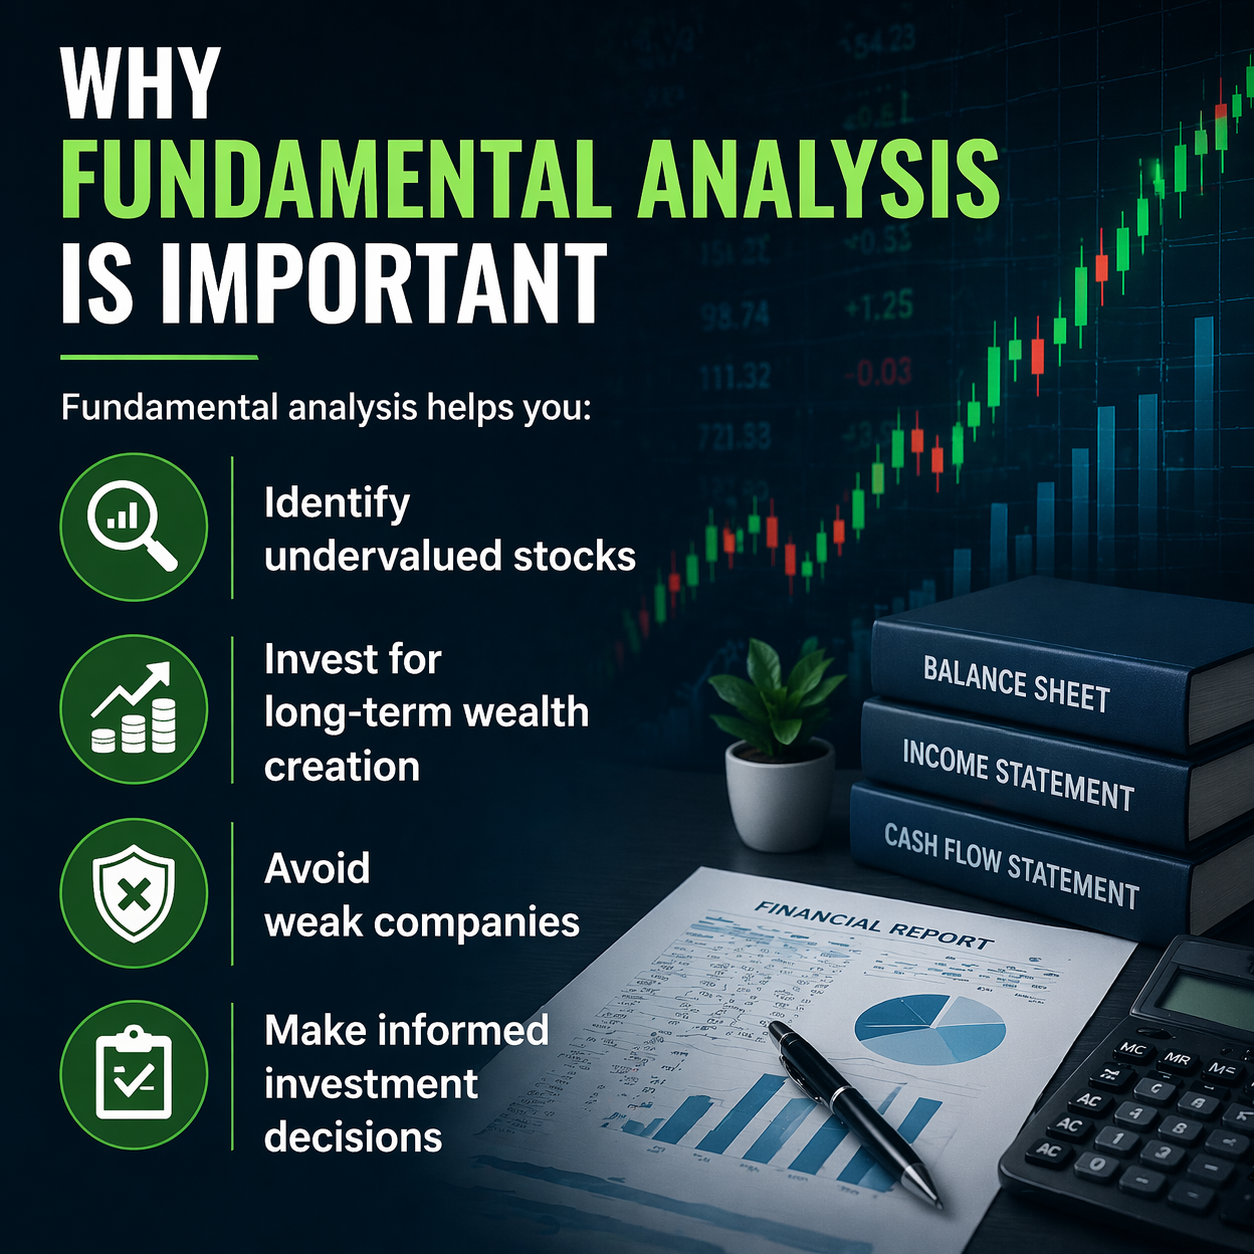
- Identify undervalued stocks
- Invest for long-term wealth creation
- Avoid weak companies
- Make informed investment decisions
It is especially useful for long-term investment in the stock market.
What is Technical Analysis?
Technical analysis is the study of stock price movements using charts, patterns, and indicators.
Key Concepts in Technical Analysis
1. Price Charts
Charts help track price movements over time:
- Line charts
- Bar charts
- Candlestick charts
Candlestick charts are the most commonly used in technical analysis for beginners.
2. Trends
Markets usually move in trends:
- Uptrend – Prices are rising
- Downtrend – Prices are falling
- Sideways trend – Prices move within a range
Understanding trends is important for stock market trading strategies.
3. Support and Resistance
- Support: Level where price stops falling
- Resistance: Level where price stops rising
These levels help identify entry and exit points.
4. Indicators
Some popular indicators include:
- Moving Averages
- RSI (Relative Strength Index)
- MACD (Moving Average Convergence Divergence)
These tools help predict future price movement.
5. Volume Analysis
Volume shows how many shares are being traded. High volume indicates strong market interest.
Why Technical Analysis is Important
Technical analysis helps you:
- Identify the best time to buy or sell
- Understand market sentiment
- Improve short-term trading decisions
- Reduce emotional decisions
It is very useful for intraday trading for beginners and swing trading.
Which is Better for Beginners?
It depends on your goals.
For Long-Term Investors
Choose fundamental analysis
- Helps build wealth
- Focus on strong companies
- Less frequent monitoring
For Traders
Choose technical analysis
- Helps in short-term profits
- Useful for daily or swing trading
- Requires regular practice
Using Both Together
The best approach is to combine both methods.
Step-by-Step Strategy:
- Use fundamental analysis to select strong companies
- Use technical analysis to find the right entry point
- Monitor performance regularly
This strategy improves accuracy and reduces risk.
Advantages and Disadvantages
Fundamental Analysis Advantages
- Best for long-term investing
- Helps identify strong companies
- Lower risk compared to trading
Limitations
- Time-consuming
- Does not help with timing
- Requires financial knowledge
Technical Analysis Advantages
- Helps in entry and exit timing
- Useful for active traders
- Works well in trending markets
Limitations
- Can give false signals
- Requires experience
- Not always reliable
Common Mistakes Beginners Should Avoid
- Ignoring fundamentals completely
- Relying only on indicators
- Overtrading
- Following market tips blindly
- Expecting quick profits
Frequently Asked Questions (FAQ)
1. What is the difference between fundamental and technical analysis?
Fundamental analysis studies company financials, while technical analysis studies price charts and patterns.
2. Which is better for beginners?
Fundamental analysis is better for beginners as it focuses on long-term investment and company basics.
3. Can I use both methods together?
Yes, combining both methods improves decision-making and reduces risk.
4. Is technical analysis enough for investing?
Technical analysis is useful for timing, but combining it with fundamentals gives better results.
5. How long does it take to learn stock market analysis?
Basic concepts can be learned in a few weeks, but mastering them takes time and practice.
6. What should I learn first?
Start with stock market basics and fundamental analysis, then move to technical analysis.
Latest Course


")
Latest posts

")


")
Copyright © By Empirical F&M Academy. Design & Developed by Techno Duniya