
MACD and Stochastic Strategy: A Complete Guide for Beginners (2026)
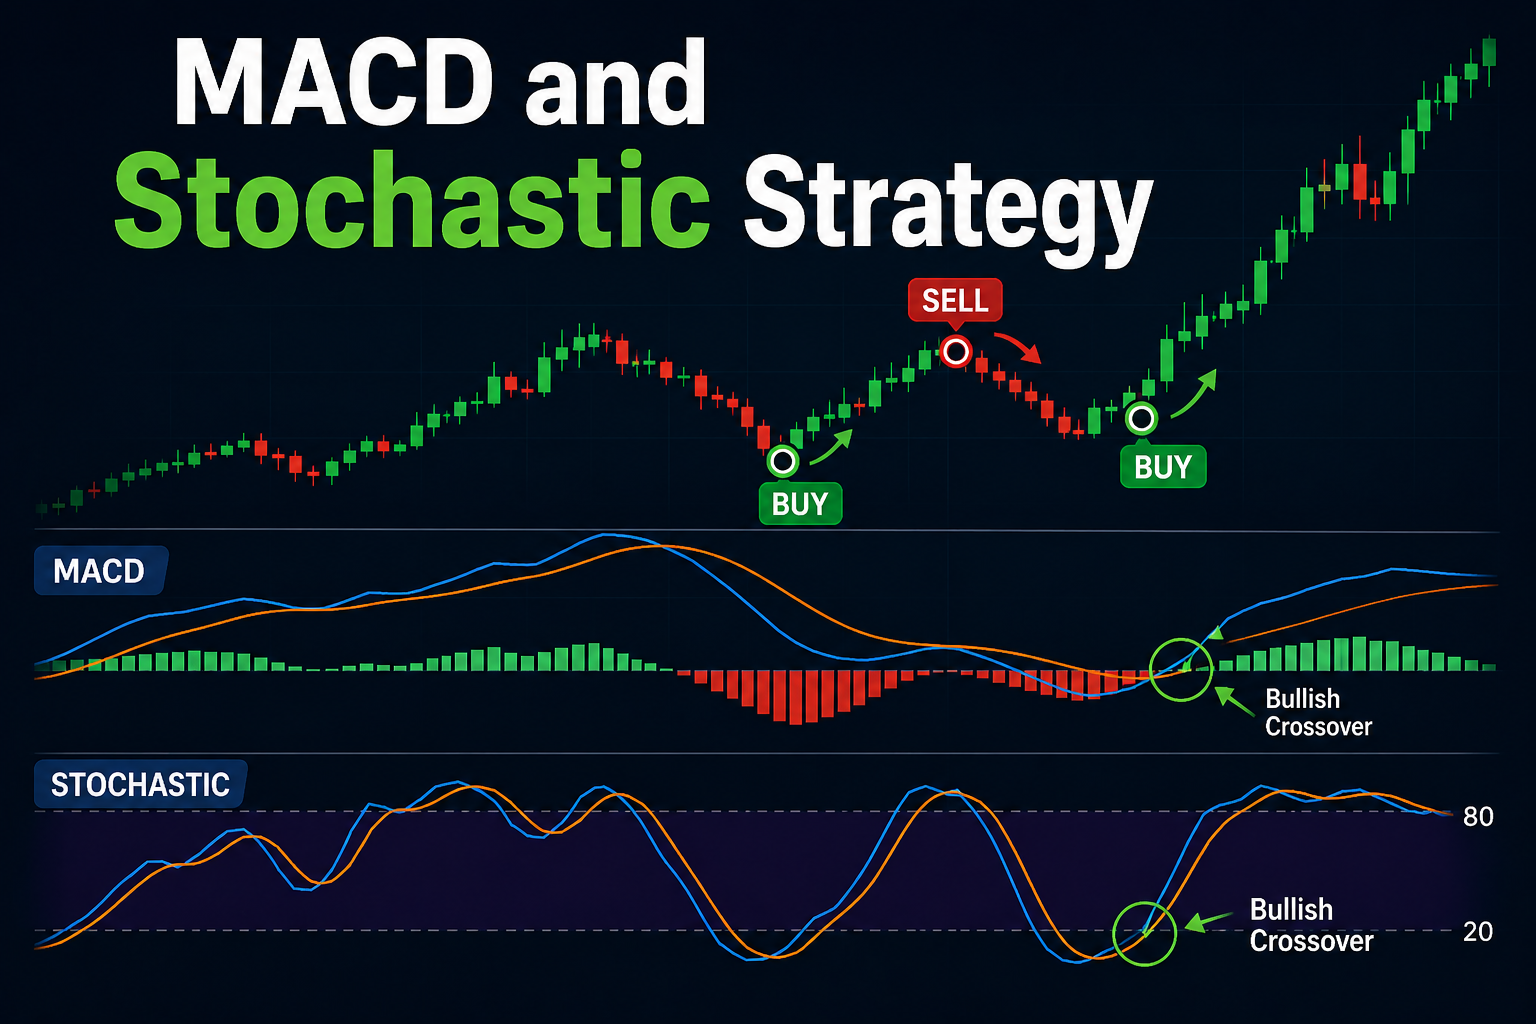
MACD and Stochastic Strategy: A Complete Guide for Beginners (2026)
If you have ever searched for "MACD Stochastic strategy," "best indicator combination for intraday trading," or "how to combine MACD and Stochastic," this guide will explain everything in simple English, step by step. And if you'd rather learn this hands-on with an expert, Empirical F&M Academy's Technical Analysis course walks you through indicator strategies like this one on live charts.
What Is MACD? (Moving Average Convergence Divergence)
MACD is a trend-following momentum indicator. It shows the relationship between two moving averages of a stock's price. It's one of the first tools taught in any solid Technical Analysis certification course, because it forms the base for many advanced strategies.
MACD has three parts:
- MACD Line – the difference between the 12-day EMA (Exponential Moving Average) and the 26-day EMA
- Signal Line – a 9-day EMA of the MACD line
- Histogram – the gap between the MACD line and the Signal line
Basic MACD signal:
- When the MACD line crosses above the Signal line → possible buy signal (bullish momentum)
- When the MACD line crosses below the Signal line → possible sell signal (bearish momentum)
What Is the Stochastic Oscillator?
The Stochastic Oscillator is a momentum indicator that compares a stock's closing price to its price range over a set period (usually 14 days). It moves between 0 and 100.
- Above 80 → the stock is considered overbought (price may fall soon)
- Below 20 → the stock is considered oversold (price may rise soon)
Stochastic is great at spotting short-term reversals, but on its own it can give too many false signals in a strong trend. This is exactly why traders combine it with MACD — a concept covered in depth in Empirical F&M Academy's Trade Smart Using Technical Analysis (Basic + Advanced) program.
Why Combine MACD and Stochastic?
Each indicator covers the other one's weakness:
|
Indicator |
Strength |
Weakness |
|
MACD |
Confirms trend direction and momentum |
Can lag behind price (late signals) |
|
Stochastic |
Spots overbought/oversold zones early |
Gives false signals in strong trends |
When you combine MACD (trend confirmation) with Stochastic (timing), you filter out weak trades and only act when both indicators agree. This is called signal confirmation, and it is one of the most searched technical analysis strategies among Indian traders learning intraday trading and swing trading.
How the MACD and Stochastic Strategy Works: Step-by-Step
Step 1: Set Up Your Chart
Add MACD (12, 26, 9) and Stochastic Oscillator (14, 3, 3) below your price chart. Most trading platforms and charting tools (like TradingView) have these built in. If chart setup feels confusing at first, this is one of the very first practical skills covered in Empirical Academy's Technical Analysis course.
Step 2: Identify the Trend with MACD
Check whether the MACD line is above the signal line (uptrend) or below it (downtrend).
Step 3: Look for a Stochastic Confirmation
- For a buy trade: Stochastic should be below 20 (oversold) and starting to turn upward.
- For a sell trade: Stochastic should be above 80 (overbought) and starting to turn downward.
Step 4: Enter the Trade
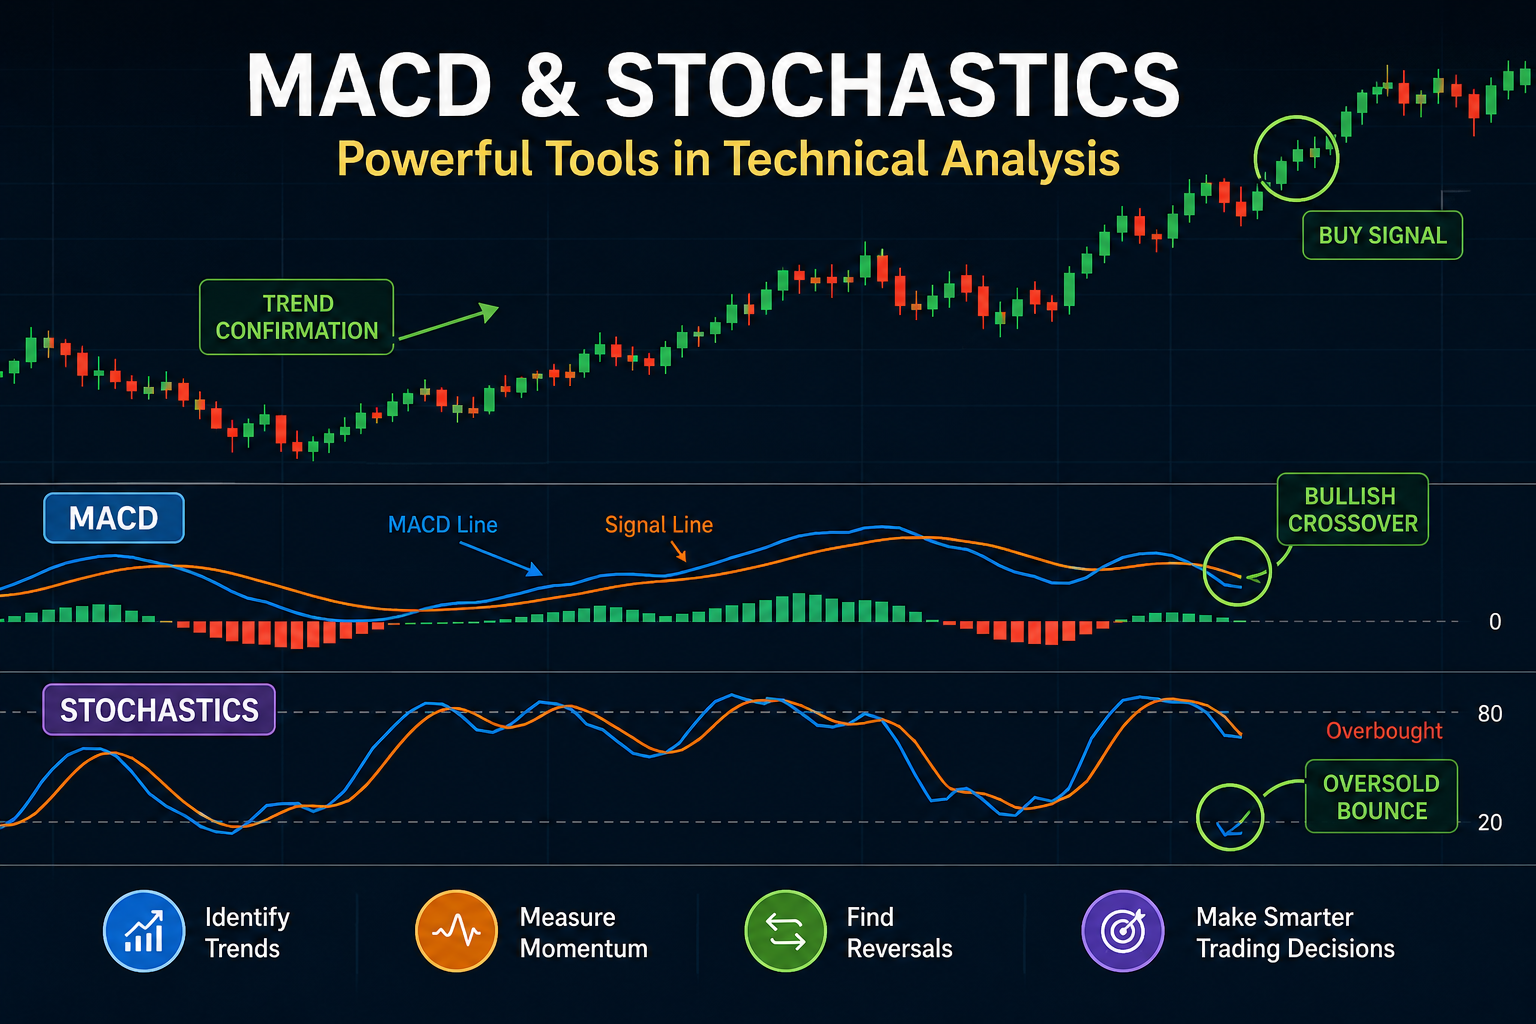
- Buy Signal: MACD line crosses above the signal line AND Stochastic is coming out of the oversold zone (below 20).
- Sell Signal: MACD line crosses below the signal line AND Stochastic is coming out of the overbought zone (above 80).
Step 5: Set Stop-Loss and Target
- Place a stop-loss just below the recent swing low (for buy trades) or above the recent swing high (for sell trades).
- Use a risk-reward ratio of at least 1:2 to keep your trading disciplined. Risk management like this is a core module in the Intraday Trading Course at Empirical F&M Academy.
Example of MACD + Stochastic Strategy in Action
Imagine a stock is falling and the Stochastic Oscillator drops below 20, showing it is oversold. A few candles later, the MACD line crosses above the signal line, confirming that bullish momentum is returning. This combination gives a much stronger buy signal than either indicator would give alone. Traders often apply this exact setup while trading index stocks — something explored further in the Nifty & Bank Nifty Trading Strategies & Methods course.
Best Timeframes for This Strategy
- Intraday trading: 5-minute or 15-minute charts — best learned through the Intraday Trading Course
- Swing trading: Daily charts
- Positional trading: Weekly charts
Beginners should practice this strategy on a demo account or through paper trading before using real capital. If you want structured, hands-on training in reading charts and applying strategies like this, Empirical F&M Academy's Technical Analysis course covers indicator-based strategies in detail with live examples.
Common Mistakes Traders Make
- Trading every crossover – Not every MACD crossover is a valid signal; always wait for Stochastic confirmation.
- Ignoring the overall trend – Avoid taking buy signals in a strong downtrend just because Stochastic looks oversold.
- Skipping stop-loss – Never trade without a predefined stop-loss, no matter how strong the signal looks.
- Using it in isolation – Combine MACD and Stochastic with support/resistance levels and volume analysis for better accuracy. This kind of multi-indicator approach is exactly what's taught in the Trade Smart Using Technical Analysis (Basic + Advanced) program.
MACD and Stochastic vs Other Indicator Combinations
Many traders also combine MACD with RSI (Relative Strength Index) or use Stochastic with Bollinger Bands. The MACD-Stochastic pair is popular because MACD is a trend indicator and Stochastic is a momentum/reversal indicator — together they balance trend and timing, which is what most intraday and swing traders look for.
If you're exploring other strategy combinations beyond equities, our guide on Options Trading for Beginners explains how similar technical signals apply to calls and puts. And if you're curious about automating strategies like this one, check out our Algo Trading Course guide as well.
Is the MACD and Stochastic Strategy Good for Beginners?
Yes. This strategy is beginner-friendly because both indicators are visual — you don't need to calculate anything manually, and most charting platforms plot them automatically. However, understanding why a signal works (trend + momentum + timing) is more important than just spotting crossovers. This is best learned through structured courses rather than trial and error, especially if you plan to trade intraday. Empirical F&M Academy's Intraday Trading Course and Nifty & Bank Nifty Trading Strategies course both cover indicator-based entry and exit techniques for live markets, and both are part of the broader NSE Academy certification track.
Frequently Asked Questions (FAQs)
Q1. What is the best setting for the MACD and Stochastic strategy?
The most common settings are MACD and Stochastic. These are the default settings on most charting platforms and work well for both intraday and swing trading. You can practice these settings live in Empirical Academy's Technical Analysis course.
Q2. Can MACD and Stochastic be used for intraday trading?
Yes, this combination works well on 5-minute and 15-minute charts for intraday trading, as long as you also confirm signals with volume and support/resistance levels. The Intraday Trading Course covers this in more depth with live market practice.
Q3. Which is more reliable, MACD or Stochastic?
Neither is more reliable alone. MACD is better for confirming trend direction, while Stochastic is better for timing entries near overbought/oversold zones. Using them together, as taught in the Trade Smart Using Technical Analysis program, improves overall accuracy.
Q4. Does the MACD Stochastic strategy work in all market conditions?
It works best in trending or range-bound markets with clear momentum. In highly volatile or sideways markets, signals can be less reliable, so risk management is essential.
Q5. How do I learn technical indicator strategies properly?
Structured learning through a certified course is the fastest way to master indicator strategies with real chart practice. Explore Empirical F&M Academy's full Technical Analysis courses under NSE Academy to build a strong foundation.
Final Thoughts
The MACD and Stochastic strategy is one of the simplest yet most effective ways to combine trend confirmation with precise entry timing. Like any strategy, it works best with proper risk management, practice, and an understanding of the broader market trend — not as a standalone system.
If you want to go deeper and learn how professional traders build complete strategies using MACD, Stochastic, RSI, and price action together, explore our full range of stock market courses or check out more strategy guides on the Empirical Academy Blog. You can also get in touch with our team to find the right course for your trading goals.
Latest Course





Latest posts




Copyright © By Empirical F&M Academy. Design & Developed by Techno Duniya