
Volume Analysis in Trading: How to Read Buying and Selling Pressure
Volume Analysis in Trading: How to Read Buying and Selling Pressure
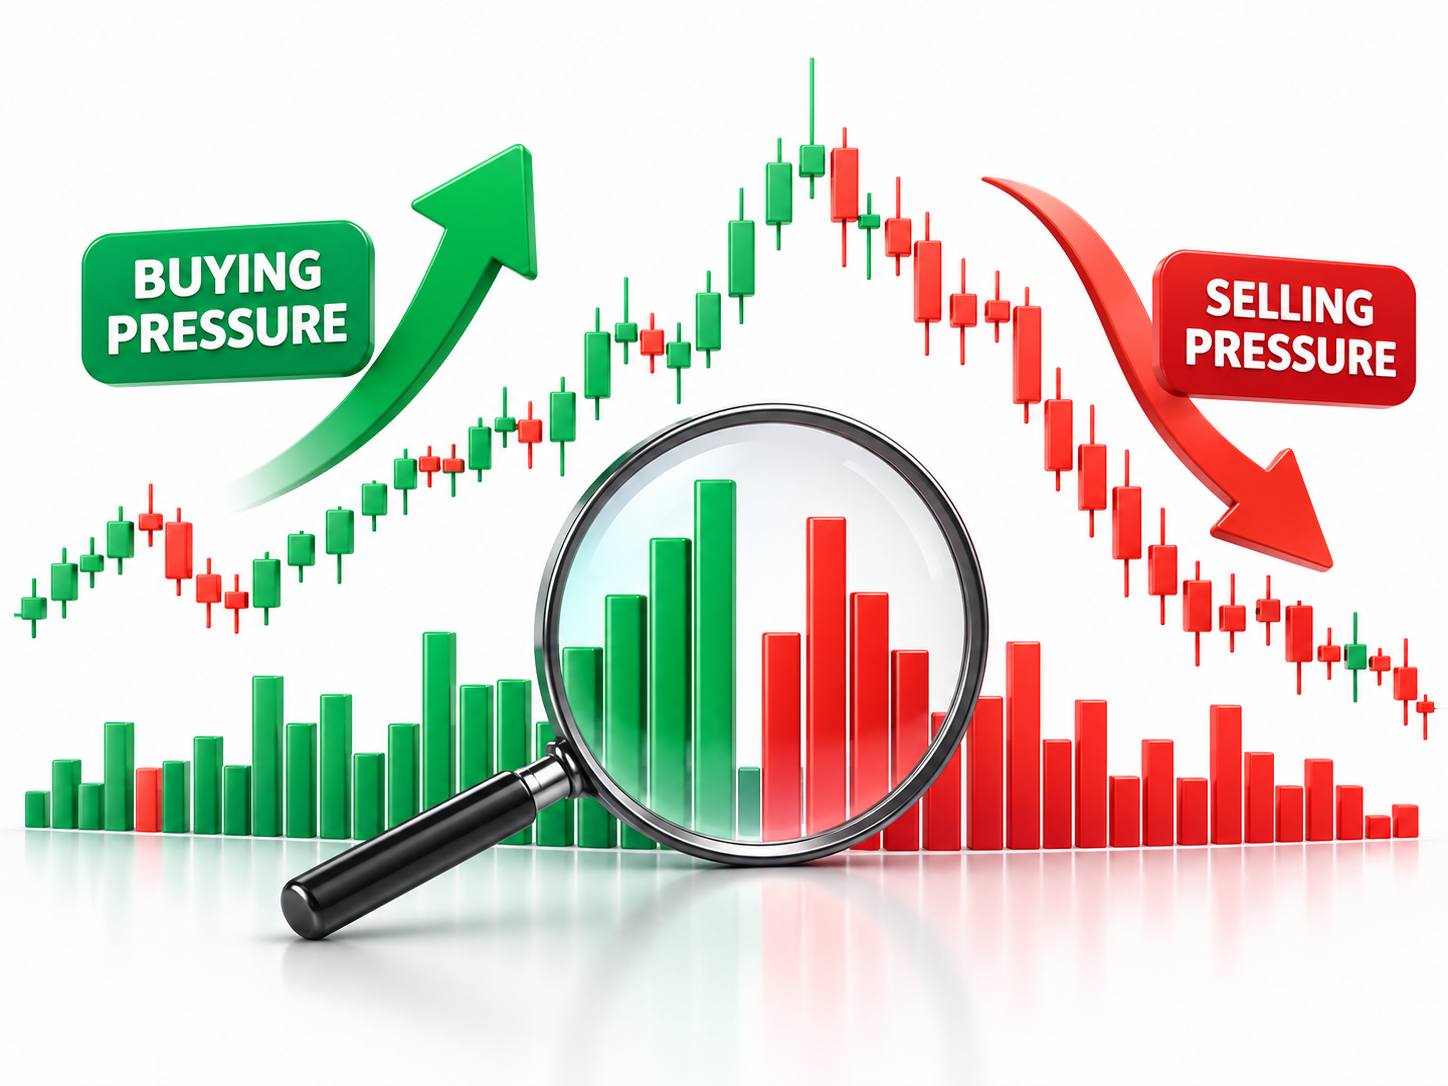
Volume analysis in trading is the study of how many shares, contracts, or lots change hands in a given period, used to judge whether buyers or sellers are in control. Price shows you where the market moved. Volume shows you how much conviction was behind the move.
A price rise on heavy volume suggests real buying pressure. The same rise on thin volume often signals a weak move that may not last. Learning to read this difference is one of the fastest ways to improve your trade timing.
Key Takeaways
- Volume measures participation. Rising volume confirms a move, and falling volume questions it.
- Buying pressure shows up as strong closes near the high on above-average volume. Selling pressure shows up as weak closes near the low on above-average volume.
- Always read volume together with price action and market structure, never alone.
- Useful tools include volume bars, VWAP, On-Balance Volume (OBV), and volume profile.
- For indices like Nifty and Bank Nifty, use futures volume, since spot indices carry no true traded volume.
What Is Volume in Trading?
Volume is the total quantity of an asset traded during a specific time frame, such as one 5-minute candle or one trading day. Each trade needs a buyer and a seller, so volume itself is neither bullish nor bearish. Its meaning comes from the context: the direction of price, the size of the candle, and where it appears on the chart.
Why Does Volume Matter?
Volume matters because it reveals whether large participants are involved. Institutions, funds, and operators cannot hide size. When they accumulate or distribute, it leaves a footprint in volume before price fully reflects it.
Three things volume helps you answer:
- Is this move genuine? Strong volume backs a breakout. Weak volume suggests a trap.
- Is the trend healthy? A trend that keeps making new highs on shrinking volume is losing fuel.
- Who is winning right now? Buyers or sellers.
How to Read Buying Pressure
Buying pressure is the dominance of buyers over sellers, pushing price higher. Look for these signs:
- Wide-range green candles on above-average volume. Buyers are aggressive and willing to pay up.
- Close near the high of the candle. Sellers tried to push back but failed.
- Pullbacks on low volume. Dips lack seller conviction, so the trend is likely to continue.
- Breakouts above resistance with a volume surge. The market is accepting higher prices.
How to Read Selling Pressure
Selling pressure is the dominance of sellers over buyers, pushing price lower. Look for these signs:
- Wide-range red candles on heavy volume. Sellers are aggressive.
- Close near the low of the candle. Buyers could not absorb the supply.
- Rallies on falling volume. Bounces lack buyer commitment and often fail.
- Breakdowns below support with a volume spike. Lower prices are being accepted.
Volume and Price: The Four Core Relationships
| Price | Volume | What It Usually Means |
|---|---|---|
| Rising | Rising | Strong uptrend, healthy buying pressure |
| Rising | Falling | Weak rally, possible exhaustion |
| Falling | Rising | Strong downtrend, healthy selling pressure |
| Falling | Falling | Weak decline, possible bottoming |
These are tendencies, not guarantees. Always confirm with structure, such as support, resistance, and trend.
Key Volume Patterns Every Trader Should Know
1. Volume Breakout Confirmation
When price breaks a key level and volume is clearly above its recent average, the breakout has a higher chance of holding. A breakout on low volume deserves suspicion.
2. Climactic Volume (Exhaustion)
An extreme volume spike after a long trend can mark exhaustion. Emotion peaks, late participants rush in, and smart money often exits into that liquidity. This can precede a reversal, but wait for price confirmation.
3. Volume Divergence
If price makes a new high but volume is lower than on the previous high, the move has less participation. Divergence is a warning, not a standalone signal.
4. Absorption
Heavy volume with very little price movement means one side is absorbing the other’s orders. Heavy selling that cannot push price down, for example, suggests strong hidden buying.
5. Dry-Up Before a Move
Volume contracting inside a tight range often precedes expansion. Many strong moves begin from these quiet pauses.
Best Volume Indicators for Reading Market Pressure
Volume bars: The basic histogram under your chart. Compare each bar against a moving average of volume (for example, 20 periods) to judge whether it is truly high or low.
VWAP (Volume Weighted Average Price): The average price weighted by volume, most useful intraday. Price holding above VWAP generally reflects buyer control, and price below it reflects seller control.
On-Balance Volume (OBV): A running total that adds volume on up days and subtracts it on down days. A rising OBV alongside rising price confirms the trend, and a flat or falling OBV warns of weakness.
Volume Profile: Shows volume traded at each price level, not each time period. High-volume nodes act as support or resistance, and low-volume areas are where price tends to move quickly.
A Simple Step-by-Step Way to Apply Volume Analysis
- Identify the trend and key levels on a higher time frame.
- Mark support, resistance, and VWAP (for intraday trading).
- Wait for price to reach a level, then watch the volume on the reaction.
- Check candle quality. Look at the range, the close, and the volume together.
- Confirm before entry. Look for a breakout with volume, a rejection with volume, or a pullback with drying volume.
- Place a stop-loss beyond the structure that invalidates your idea.
Common Mistakes in Volume Analysis
- Using volume in isolation. Volume without price context is noise.
- Ignoring the time of day. Volume is naturally higher at the open and close, so compare like with like.
- Reading spot index volume. For Nifty or Bank Nifty, use the futures contract.
- Chasing every spike. High volume at the end of a long move can mean exhaustion, not continuation.
- No risk management. Even strong volume signals fail sometimes.
Frequently Asked Questions
Q1. What is volume analysis in trading?
Volume analysis is the practice of studying traded quantity alongside price to judge the strength behind a move and the balance between buyers and sellers.
Q2. How do you know if buyers or sellers are in control?
Look at price direction, candle close, and volume together. Strong green candles closing near the high on heavy volume point to buyers. Strong red candles closing near the low on heavy volume point to sellers.
Q3. Does high volume mean the price will go up?
No. High volume only means high participation. Direction depends on whether the volume comes with rising or falling prices and on the broader context.
Q4. What is the best volume indicator for beginners?
Start with plain volume bars plus a volume moving average, then add VWAP for intraday trading. OBV and volume profile can come later.
Q5. Is volume analysis useful for intraday and swing trading?
Yes. Intraday traders often use volume with VWAP and opening range levels. Swing traders use volume on daily charts to confirm breakouts, trend health, and potential reversals.
Q6. Can volume analysis be used in forex?
Spot forex has no centralized volume, so traders typically use tick volume as a proxy. It is less reliable than exchange-traded volume in equities and futures.
Take Your Volume Analysis Further
Reading volume well takes practice, and it works best when built on a solid base of price action, market structure, and risk management. If you want a structured path from fundamentals to applied trading skills, explore the Empirical F&M Academy course, which covers the foundations of the financial markets and trading in a step-by-step format.
Disclaimer: This article is for educational purposes only and is not financial advice. Trading involves risk, and you can lose money. Do your own research or consult a registered advisor before making decisions.
Latest Course





Latest posts




Copyright © By Empirical F&M Academy. Design & Developed by Techno Duniya