
What Is Price Action Trading? A Beginner's Guide for Indian Traders

What Is Price Action Trading? A Beginner's Guide for Indian Traders
Price action trading is a method of buying and selling based on how a chart's price actually moves, using candlesticks, support and resistance, and trend structure instead of lagging indicators like RSI or MACD. For Indian traders, it means reading Nifty, Bank Nifty and NSE or BSE stocks directly from the chart.
Key takeaways
- Price action means reading the open, high, low and close of each candle to judge who is in control, buyers or sellers.
- It works on Indian stocks, indices, futures and options (through the underlying chart) and on any timeframe.
- The core tools are candlesticks, support and resistance, trend structure and volume.
- Beginners do best on higher timeframes with a fixed risk per trade and a written plan.
- Trading carries real risk. SEBI studies have found that roughly nine in ten individual F&O traders lose money, so practise before you risk capital.
How Does Price Action Trading Work?
Price action trading works by treating price as the one signal that cannot lag. Every candle records a fight between buyers and sellers, and patterns in those candles show where demand or supply is likely to appear again.
A price action trader asks three simple questions before every trade:
- What is the trend? Is the market making higher highs and higher lows, lower highs and lower lows, or moving sideways?
- Where are the key levels? Which support and resistance zones has price respected before?
- Is there a trigger? Does a candle pattern at that level, such as a rejection wick or an engulfing candle, confirm the idea?
When the answers line up, the trader enters with a pre-defined stop-loss and target. When they do not, the trader waits. This patience is the real skill.
Why Price Action Suits Indian Traders
Price action is popular in India because the Indian market gives you clean, liquid charts to practise on and a fixed daily rhythm to learn from.
- Liquid benchmarks: Nifty 50, Bank Nifty and Sensex, plus large-cap NSE stocks, trade with deep volumes, so levels tend to be respected.
- A fixed session: NSE equity trading runs from 9:15 AM to 3:30 PM IST, which gives every trader the same opening, midday and closing behaviour to study.
- Event-driven moves: Budget day, RBI policy, results season, global cues and weekly expiry days all leave clear footprints on the chart.
- Fewer moving parts: A clean chart with no stack of indicators is easier to read quickly, which matters in fast intraday moves.
- Works across instruments: The same skills apply to equities, index futures and options, where you read the underlying chart to pick direction.
If you want a structured path into markets instead of scattered videos, the Empirical F&M Academy course is a good place to start.
The 5 Building Blocks of Price Action Trading
Every price action strategy, however advanced it looks, is built from the same five parts. Learn these before anything else.
1. Candlesticks
A candlestick shows the open, high, low, and close for a period. The body shows who won the period, and the wicks show where price was rejected.
- Pin bar or hammer: a long wick and a small body, showing sharp rejection of a price level.
- Engulfing candle: a candle whose body fully covers the previous one, showing a shift in control.
- Inside bar: a candle contained within the previous candle's range, showing a pause before a possible breakout.
- Doji: open and close almost equal, showing indecision.
A candle means little on its own. It matters when it forms at a meaningful level.
2. Support and Resistance
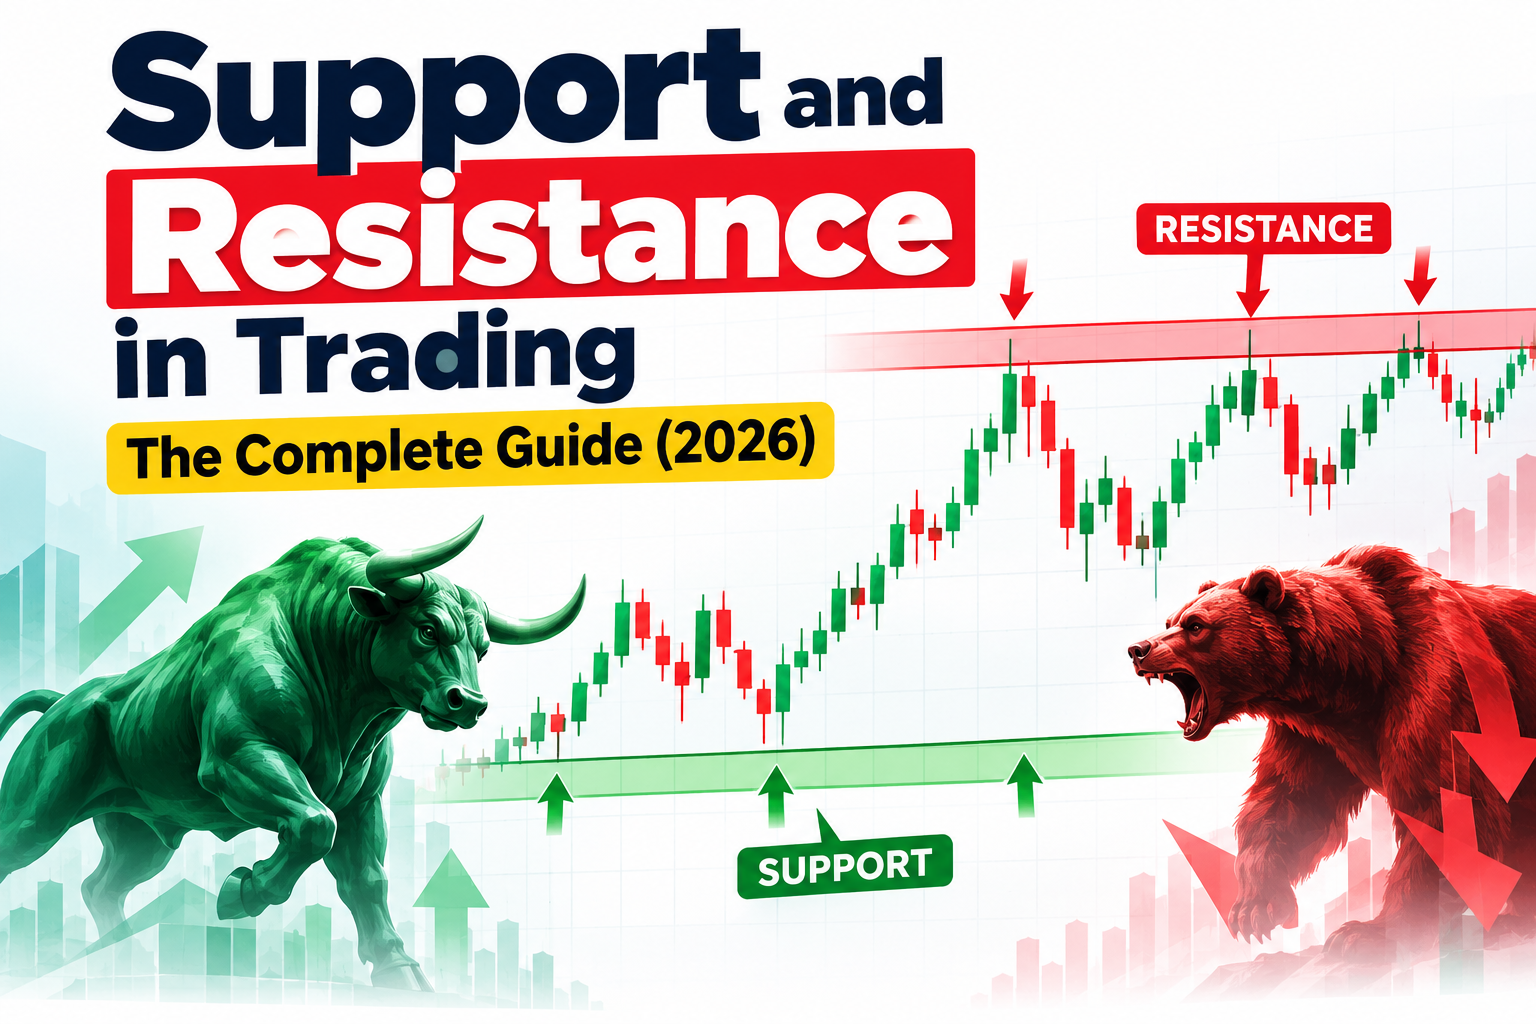
Support is a zone where buyers have repeatedly stepped in. Resistance is a zone where sellers have repeatedly pushed price down. Draw them as zones, not exact lines, using previous swing highs and lows, round numbers (such as 24,000 on Nifty) and previous day's high and low. When price breaks a resistance zone, it often turns into support, and the reverse is also true.
3. Trend and Market Structure
An uptrend is a series of higher highs and higher lows. A downtrend is a series of lower highs and lower lows. A sideways market ranges between a clear top and bottom. Trading in the direction of the higher-timeframe trend improves your odds, because you are moving with the larger flow of money. A break of the last swing low in an uptrend is an early warning that the trend may be changing.
4. Volume and Context
Volume tells you how much participation sits behind a move. A breakout on rising volume is more trustworthy than one on thin volume. Context also includes the timeframe, the time of day and nearby events such as results or policy announcements.
5. Chart Patterns
Common patterns such as flags, triangles, double tops and double bottoms are simply repeated shapes of buyer and seller behaviour. Treat them as a way to organise what you already see in levels and structure, not as magic signals.
How to Start Price Action Trading: A 7-Step Beginner Framework
- Pick one market and one chart. Start with the Nifty 50 index or two or three large-cap stocks. Do not jump between instruments.
- Choose your timeframes. Use the daily and 1-hour charts to find trend and levels, and the 15-minute chart for entries.
- Mark your key levels. Plot recent swing highs and lows, the previous day's high and low, and round numbers as zones.
- Identify the trend. Check whether structure shows higher highs and higher lows, the opposite, or a range.
- Wait for a trigger at a level. Look for a rejection wick, an engulfing candle or a clean breakout and retest before acting.
- Define risk before entry. Place the stop-loss just beyond the level or candle that proves your idea wrong, and aim for a target at least 1.5 to 2 times the risk.
- Journal every trade. Save a screenshot, the reason for entry and the result. Review weekly.
Position sizing example
With ₹1,00,000 capital and a 1% risk rule, you risk ₹1,000 per trade. If you buy a stock at ₹500 with a stop-loss at ₹490, your risk per share is ₹10. Quantity = ₹1,000 ÷ ₹10 = 100 shares.
Price Action vs Indicators: What Is the Difference?
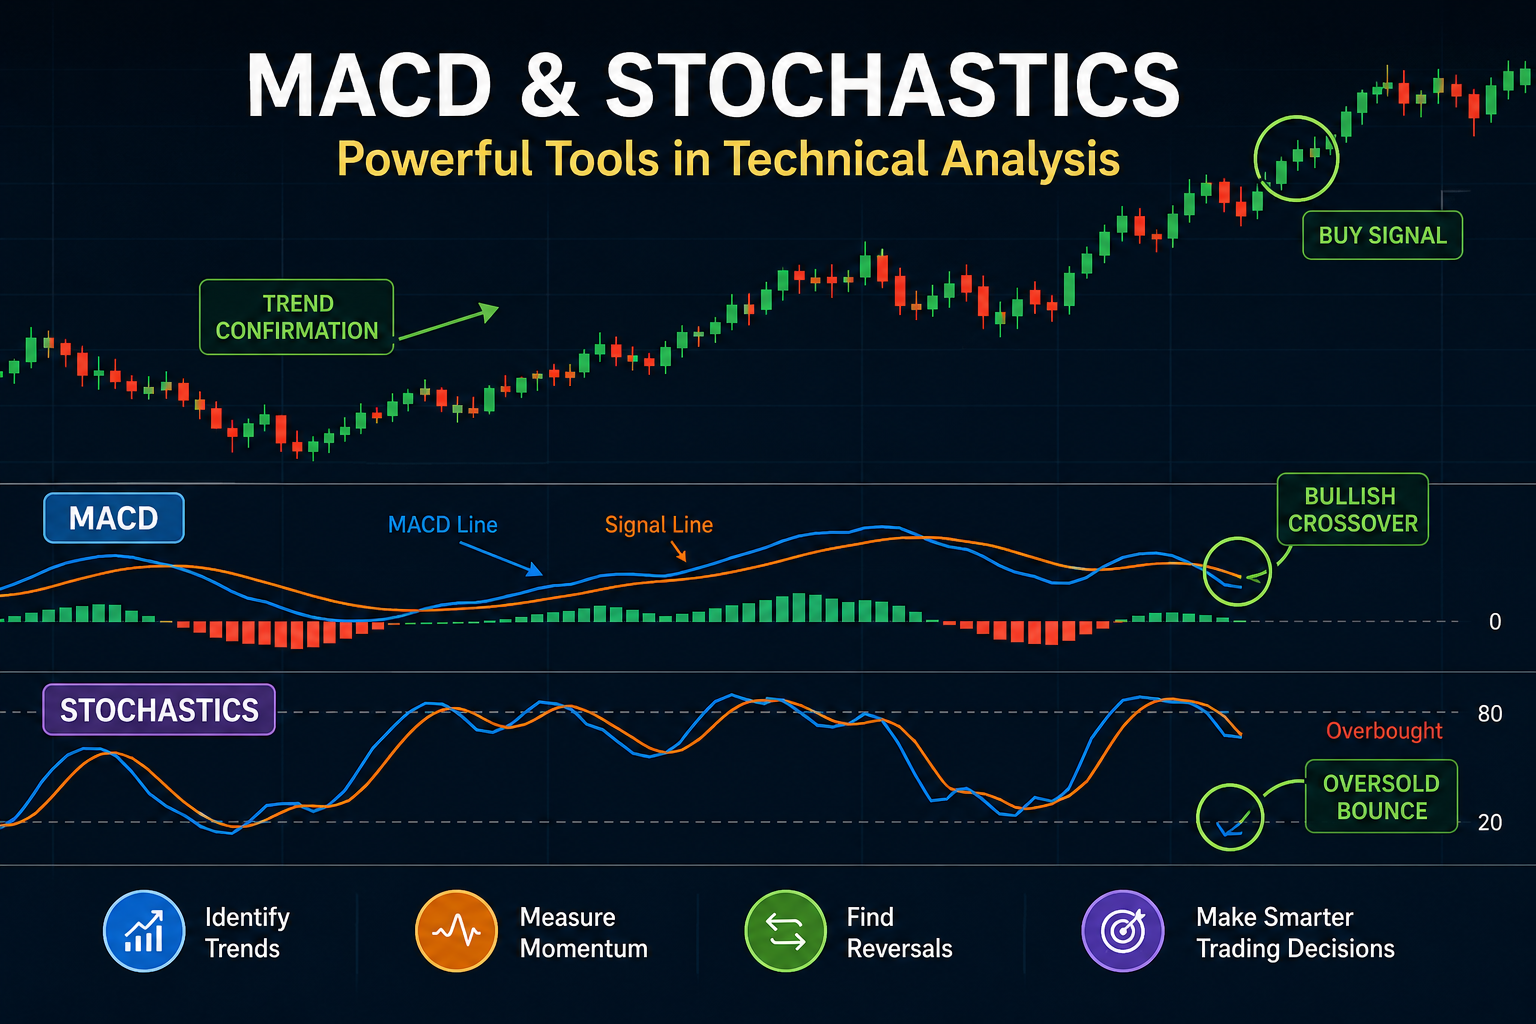
Price action reads raw price. Indicators are formulas calculated from price, so they follow it with a delay.
|
Feature |
Price action |
Indicator-based trading |
|---|---|---|
|
Data used |
Candles, levels, structure |
RSI, MACD, moving averages and similar |
|
Signal speed |
Reads the market as it happens |
Lags behind price |
|
Chart clutter |
Clean, minimal |
Often crowded |
|
Learning curve |
Needs screen time to build judgement |
Easier to start, harder to master |
|
Subjectivity |
Higher, so rules matter |
Lower, but signals can conflict |
|
Best for |
Reading trend, levels and timing |
Confirming momentum or volatility |
Many traders combine both, for example a 20 EMA as a trend filter on top of a clean price action read. The foundation should still be price.
6 Common Price Action Mistakes Beginners Make
- Trading every candle pattern. A pin bar in the middle of nowhere is noise. Trade patterns only at key levels.
- Ignoring the higher timeframe. A bullish setup on a 5-minute chart can fail against a strong daily downtrend.
- Drawing levels as thin lines. Use zones, because price rarely reverses at an exact number.
- Skipping the stop-loss. One unplanned loss can erase weeks of gains.
- Overtrading expiry days. Option premiums move fast and spreads widen, so beginners should observe before participating.
- Not journaling. Without records you cannot tell which setups actually work for you.
Risk Management and SEBI Reality Check
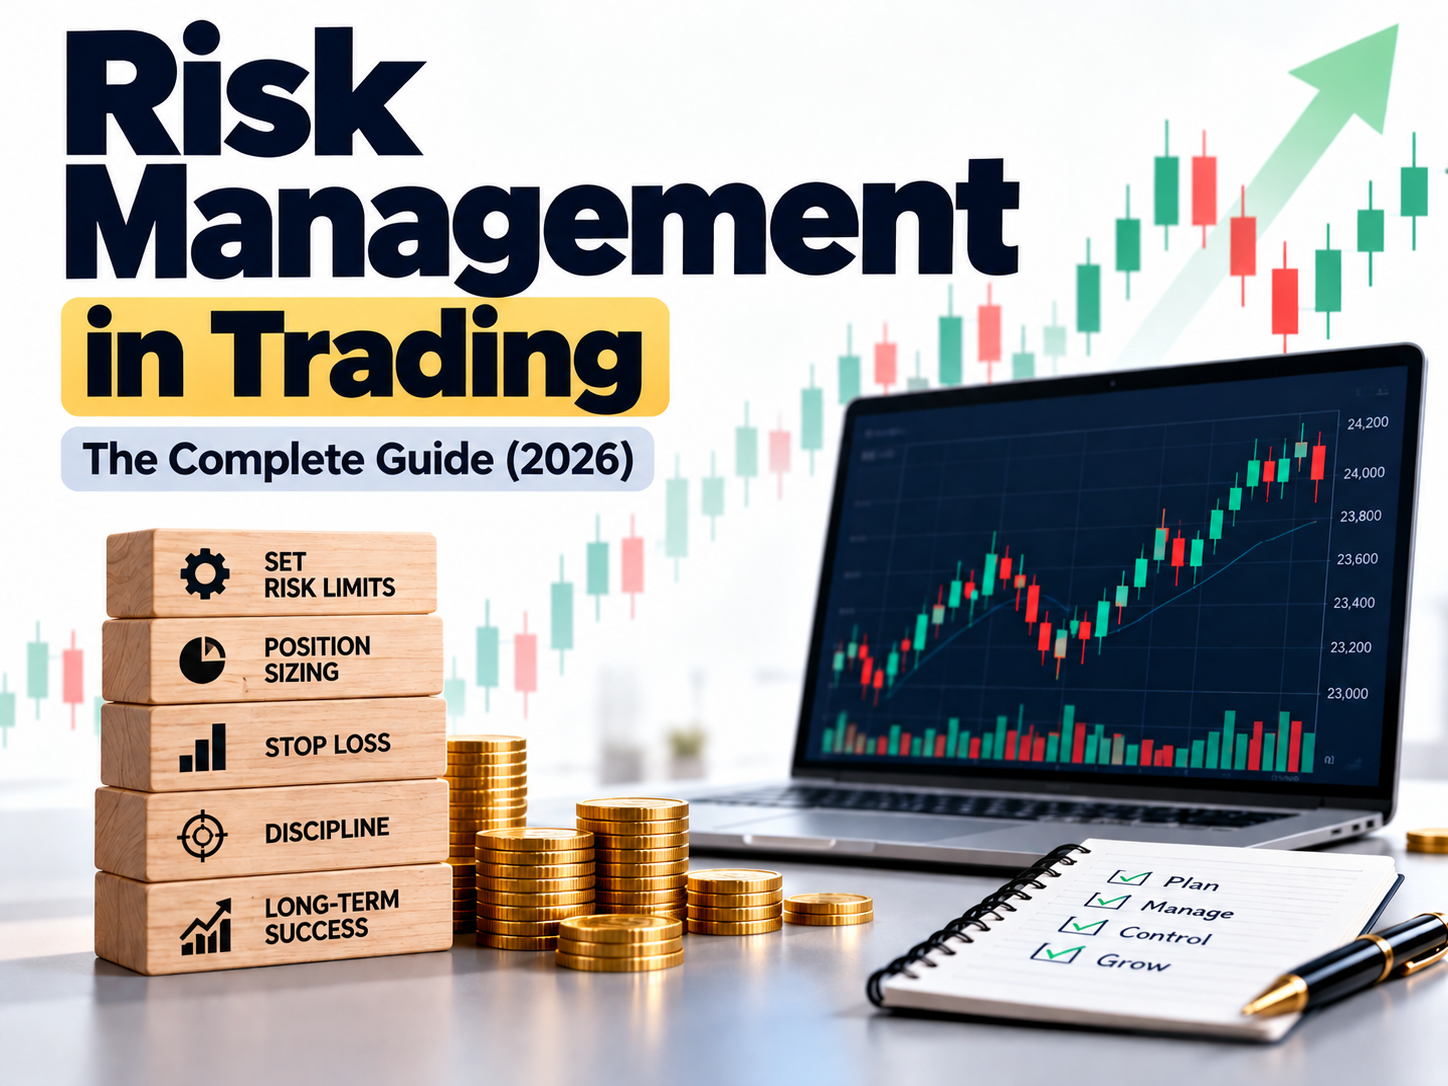
Good risk management matters more than any pattern. Risk 1% or less of capital per trade, never trade without a stop-loss, and stop trading for the day after a set loss limit.
SEBI's studies on individual traders in equity derivatives have repeatedly found that the large majority lose money after costs. Treat price action as a skill to build slowly, start with small size or paper trading, and trade only through SEBI-registered brokers. This article is educational and is not investment advice. For personal advice, consult a SEBI-registered investment adviser.
How to Learn Price Action Trading the Right Way
Reading about price action is easy. Reading a live chart under pressure is the hard part. A structured course shortens that gap because it gives you a sequence, examples and feedback instead of random tips.
When you compare learning options, look for these five things:
- Examples drawn from Indian markets such as Nifty, Bank Nifty and NSE stocks
- A clear order, from candlesticks and levels to risk management and trade planning
- Practice material, not just theory
- Honest talk about risk and losses
- A way to ask questions and get your charts reviewed
The Empirical F&M Academy course is built for learners who want a guided route into finance and markets. Check the course page for the current syllabus, schedule and fees before you enrol.
Conclusion: Start Simple, Stay Disciplined
Price action trading is the skill of reading what the market is doing right now: candles, levels and trend structure on a clean chart. For Indian traders it is a practical foundation that carries across equities, futures, and options. Start with one chart and a few simple rules, risk a small fixed amount per trade, and keep a journal.
Ready to build your skills step by step? Explore the Empirical F&M Academy course and take the next step in your trading education.
Frequently Asked Questions About Price Action Trading in India
Q1. Is price action trading profitable for beginners in India?
It can be, but nothing is guaranteed. Price action gives you rules for entries and exits, yet results depend on risk management, discipline and practice. SEBI studies show most individual F&O traders lose money, so beginners should paper trade or use small size first.
Q2. Which timeframe is best for price action trading on Nifty and Bank Nifty?
Most beginners use the daily and 1-hour charts to find trend and levels, then the 15-minute chart for entries. Higher timeframes give cleaner signals and fewer false breakouts than very short ones. Pick one combination and stay with it.
Q3. What is the difference between price action and technical indicators?
Price action reads raw candles, levels, and trend structure. Indicators such as RSI and MACD are formulas calculated from past price, so they lag. Many traders use price action as the base and add one indicator for confirmation.
Q4. How long does it take to learn price action trading?
Most beginners need around three to six months of regular study and chart practice to understand the basics. Consistent live trading usually takes longer. The timeline varies from person to person.
Q5. Can I use price action for options trading in India?
Yes. Traders read price action on the Nifty or Bank Nifty chart to decide direction and levels, then choose a call or put option. Options add time decay and volatility risk, so beginners should understand these before trading them.
Q6. Is price action trading legal in India?
Yes. Price action is only a method of analysis. Trading on NSE and BSE through a SEBI-registered broker is legal in India. Be careful with unregistered advisory services and follow SEBI rules.
Latest Course





Latest posts


Copyright © By Empirical F&M Academy. Design & Developed by Techno Duniya